Overview
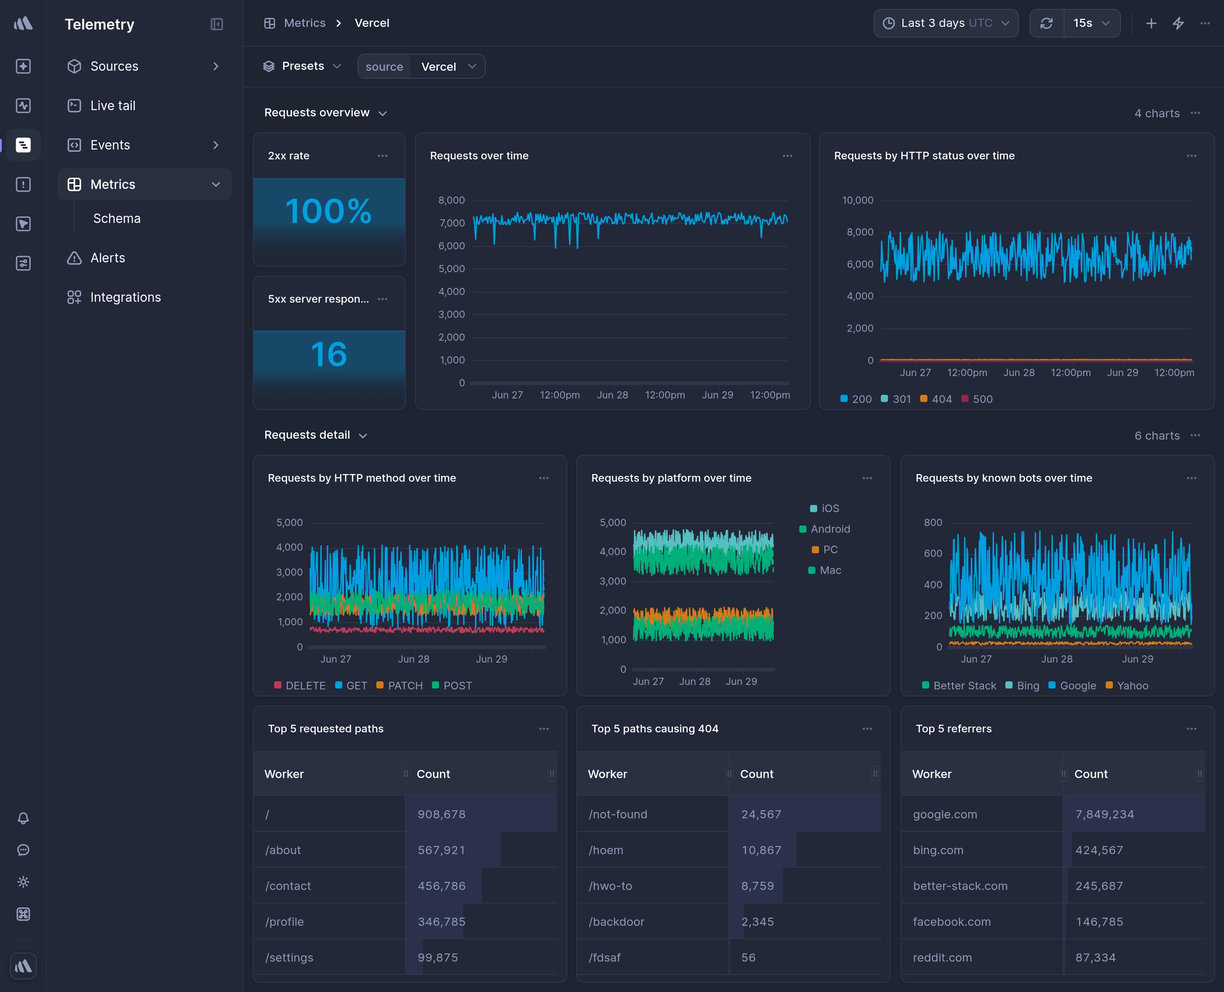
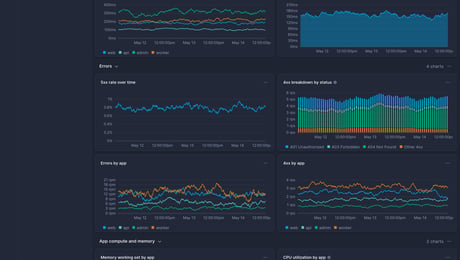
This is a ready-made Vercel Telemetry dashboard in Better Stack.
To get it, sign up for Better Stack, connect your log or metrics source, and select one of the beautiful pre-built dashboards you want to get.
What charts are included
- Requests over time
- 2xx rate
- Request by HTTP status over time
- Request by HTTP method over time
- Request by platform over time
- And much more, explore on your own to see all the chart options.
How to create a custom chart
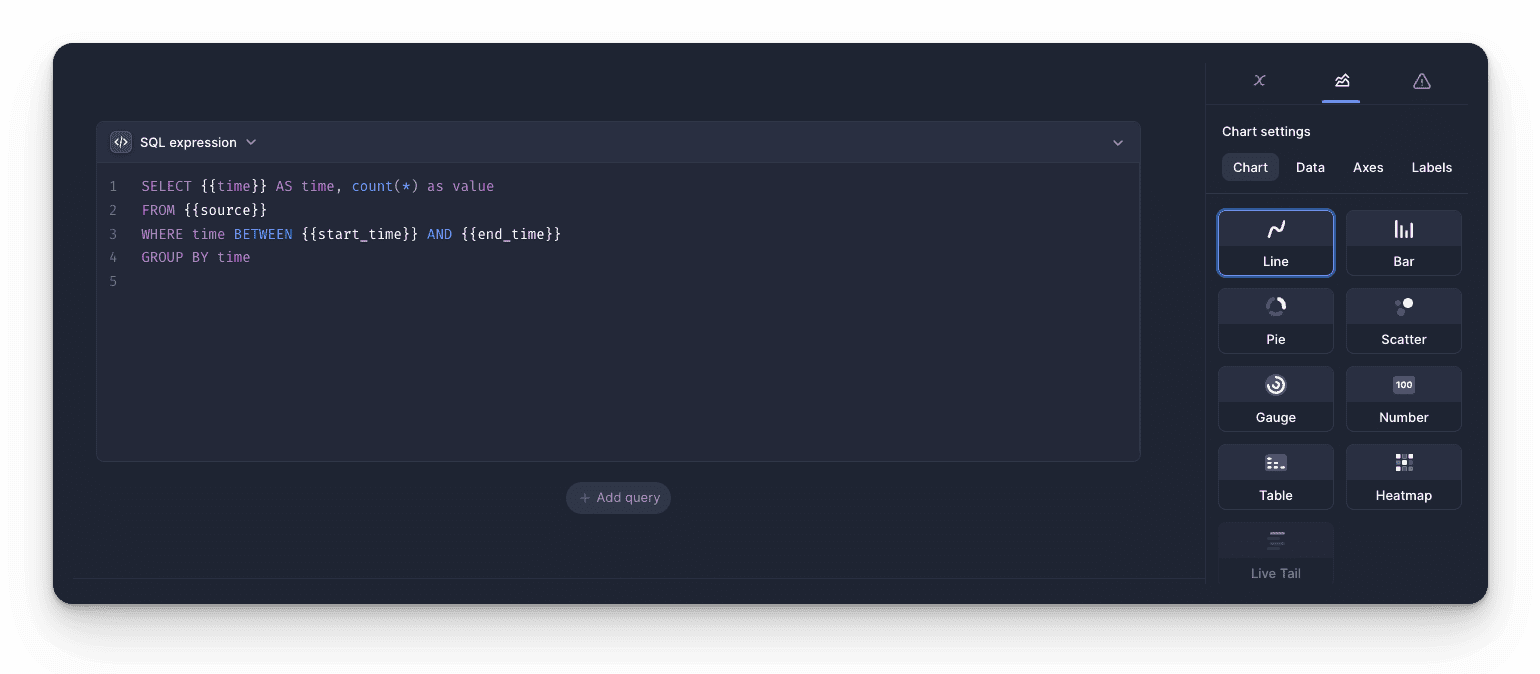
Need a custom chart? You can create one by writing a regular SQL query.
Here is how to do it:
- Pick a chart type: the most popular options include a line chart, bar chart, pie chart, a single number, and a live tail (a stream of the newest logs).
-
Pick a source and timeframe:
we use
variables
in the SQL queries, which makes it easy to edit and work with any query. The main variables are
sourceandtimeframe. Once you set those, as in the example above, you can use the timeframe switcher easily, and the dashboard will update automatically. - Write your SQL query: there is no need to use any specific querying language. Just write SQL like you’re used to.
Learn more: How to build SQL queries in Better Stack
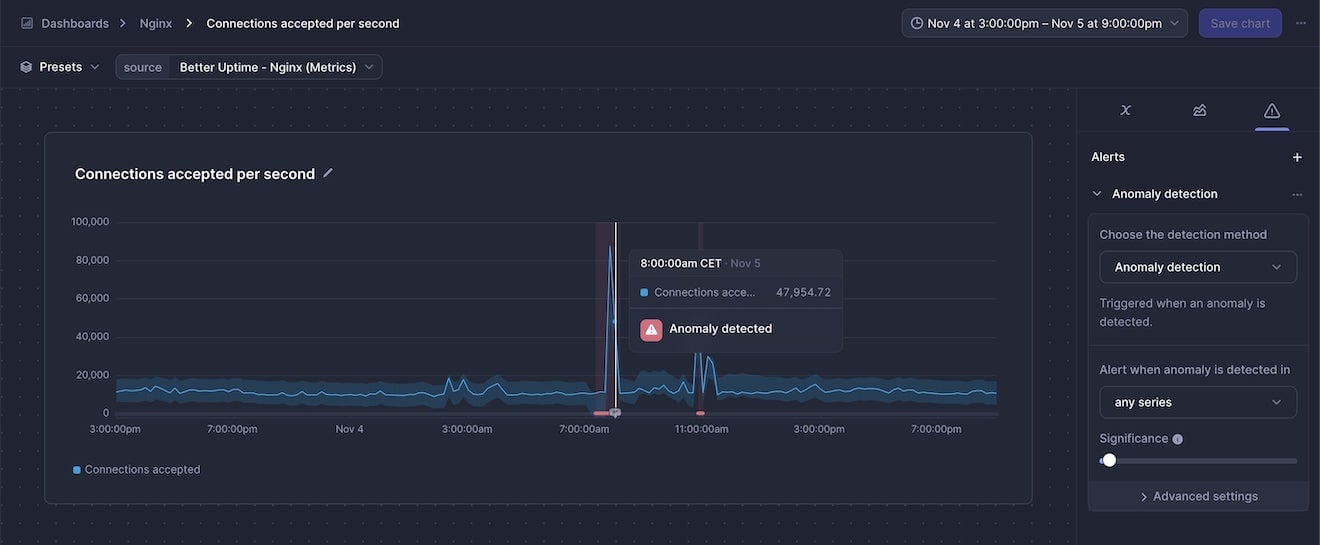
How to create an alert for a metric
You can get easily alerted on irregularities before they become incidents.
Everything is fully integrated into dashboards, there is no need to set up complex workflows.
Here are the most popular alert types:
- Threshold Alerts: Perfect for scenarios where you need to be notified when a metric crosses a certain predefined threshold. For instance, if your application's response time exceeds a set limit, you’ll get an alert.
- Relative Alerts: Want to monitor changes in metrics relative to their historical data? Whether it's an unexpected drop in sales, a surge in new user signups, or any other relative metric anomaly, we've got you covered.
- Anomaly detection: Use this alerting method if you're unsure about what threshold to set. It will notify you about any significant deviation from the predicted value of the series. Think of this method as covering what you didn’t even know can occur.
Learn more: How to use alerts in Better Stack
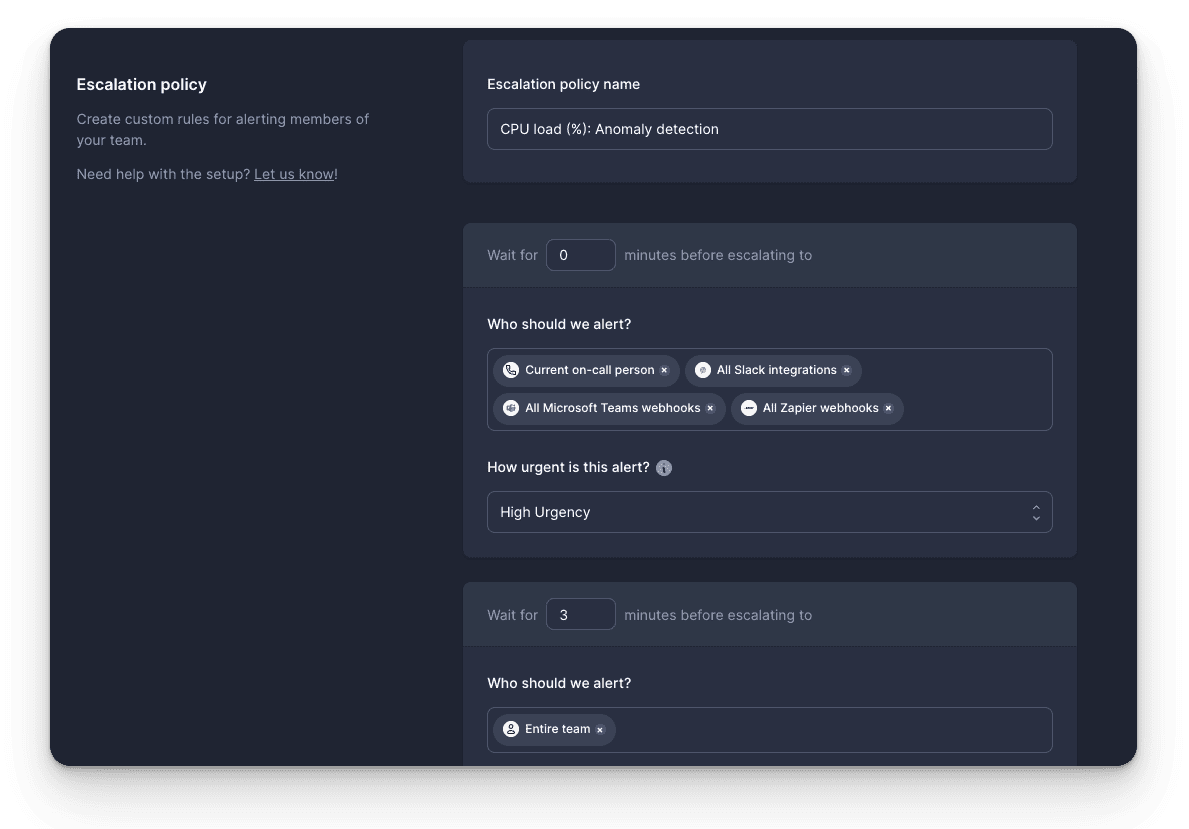
How to receive notification about issues
Once you set up what metric irregularities you want to get alerted to, you can select a broad spectrum of notification options.
The most popular include Slack, Microsoft Teams, Phone calls, SMS, emails, webhooks, and more.
The best part is that notifications within Better Stack are unlimited. This way, you don’t have to worry about being charged extra in case of significant incidents.
Learn more: How to use escalation policies in Better Stack
How to set up your Vercel dashboard
Once you’ve signed up for Better Stack, you can collect logs and metrics from Vercel in just 2 minutes. Here is the official documentation on how to do it.
Are you already using another log forwarder that you’re used to? See the documentation for Fluent Bit, Logstash, Fluentd, Filebeat, Syslog, and others.
Have any questions?
Please feel free to message us at hello@betterstack.com.
We'll get back to you as soon as we can, typically within a few hours. 🙏 Thank you!
You might also like
Please accept cookies
We use cookies to authenticate users, improve the product user experience, and for personalized ads. Learn more.