Infrastructure monitoring costs more than the infra?
30x cheaper than Datadog. Predictable pricing.
Exceptional customer support.
Datadog bill too high? Migrate today, the rest of your contract is on us.
Migration assistance and bespoke onboarding included.
Book a consultation
Relied on by the world’s best engineering teams
At a fraction of
your current costs
Get an unrivaled price-to-performance ratio. Forget sampling and ingest all your data or decrease your costs by 80x.
Ingest up to
80x more data
with the same budget
or save up to
98%
of your costs
An estimate only. Assumes annual payments, European data location, 1 responder with a Tera bundle, the average event size of 1 kB, $5 per 100 Datadog's "custom metrics". Assumes 1,000 Datadog "custom metrics" equivalent to 1 GB metrics. Further assumes Datadog's $0.1 per ingested GB of spans & logs, and $2.5/million indexed spans & logs for 30 days. Adds up to $51,200 for metrics, $2,787 for logs, and $2,787 for spans per month.
Get an AI SRE
Claude Code with the knowledge of your infrastructure.
Give LLMs the power of your telemetry data.
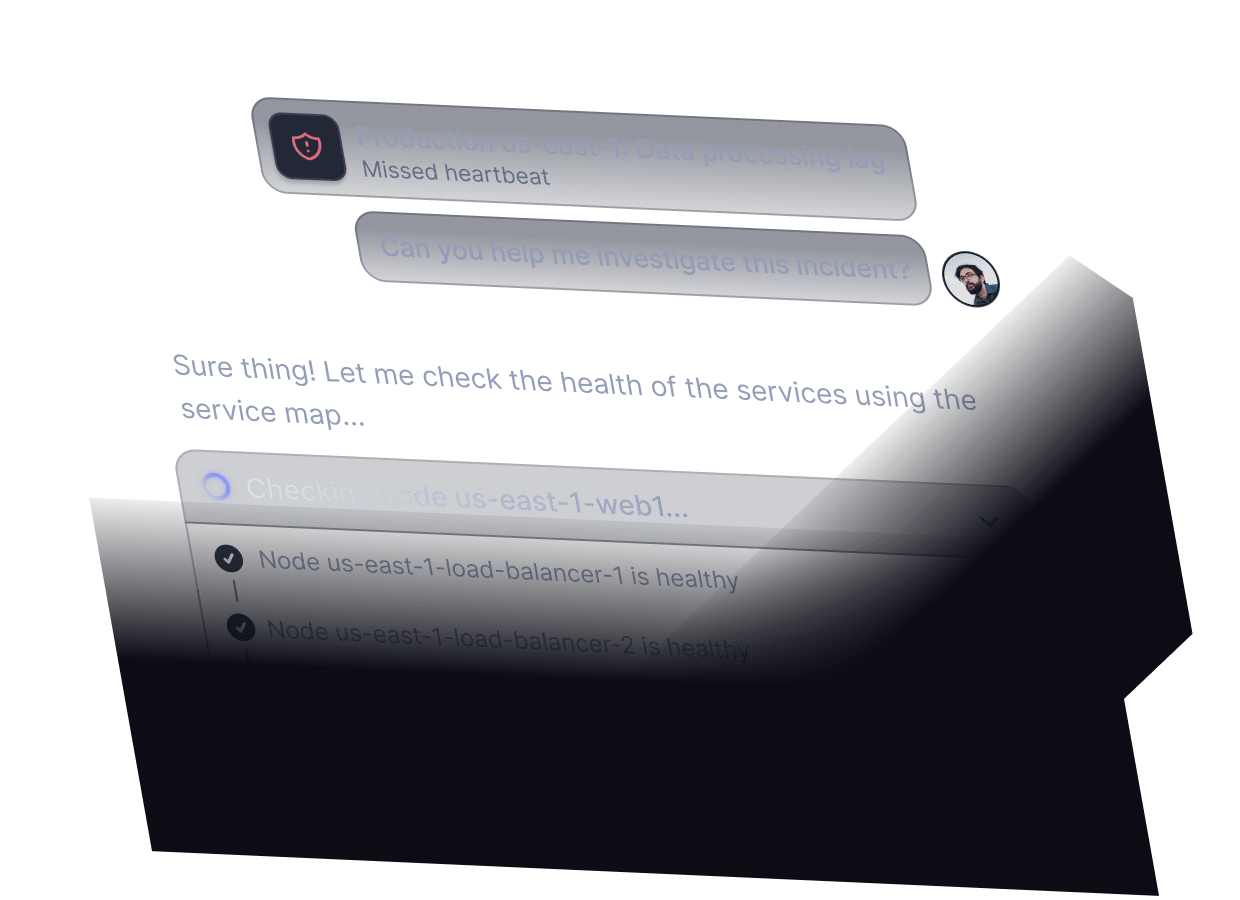
Get an AI SRE to resolve
incidents with you at 3 am
Leverage automated root cause analysis based on the eBPF-based service map & log analysis. You’re always in charge.
Robust MCP server
Integrate your telemetry data into your existing LLM workflows with a top tier MCP server.
You’re always in control
The AI SRE suggests hypotheses but never takes any automated actions without your approval. Get help when investigating an incident while remaining in charge.
Infinite scale, at self-hosted price
Better Stack delivers extremely fast, high-throughput log search and low-latency dashboards at the price of self-hosted Prometheus.
Radical usage transparency
Never worry about getting a surprise bill again. Set billing alerts and spending limits and stay fully in control.
Unlimited data retention
With 13 months default retention for all metrics, long-term storage was never easier.

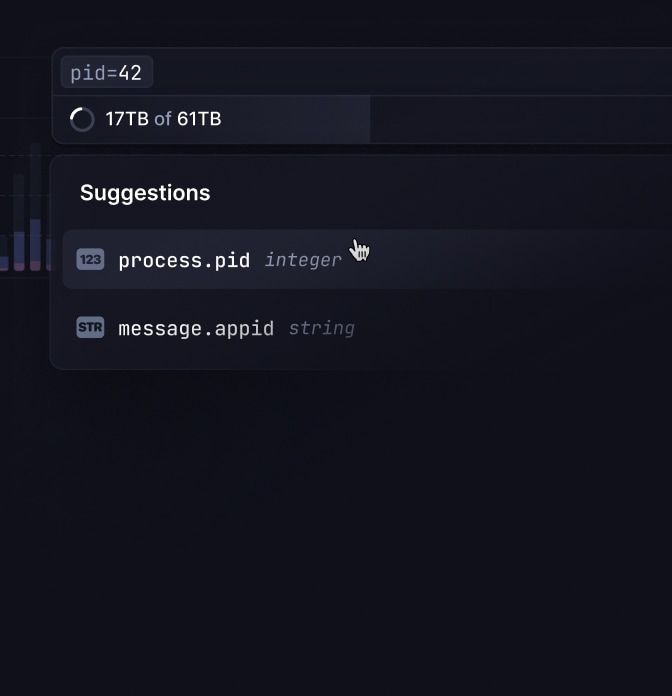
OpenTelemetry & Prometheus-native
Start in minutes using your existing metrics collectors, or create custom metrics directly from your logs.
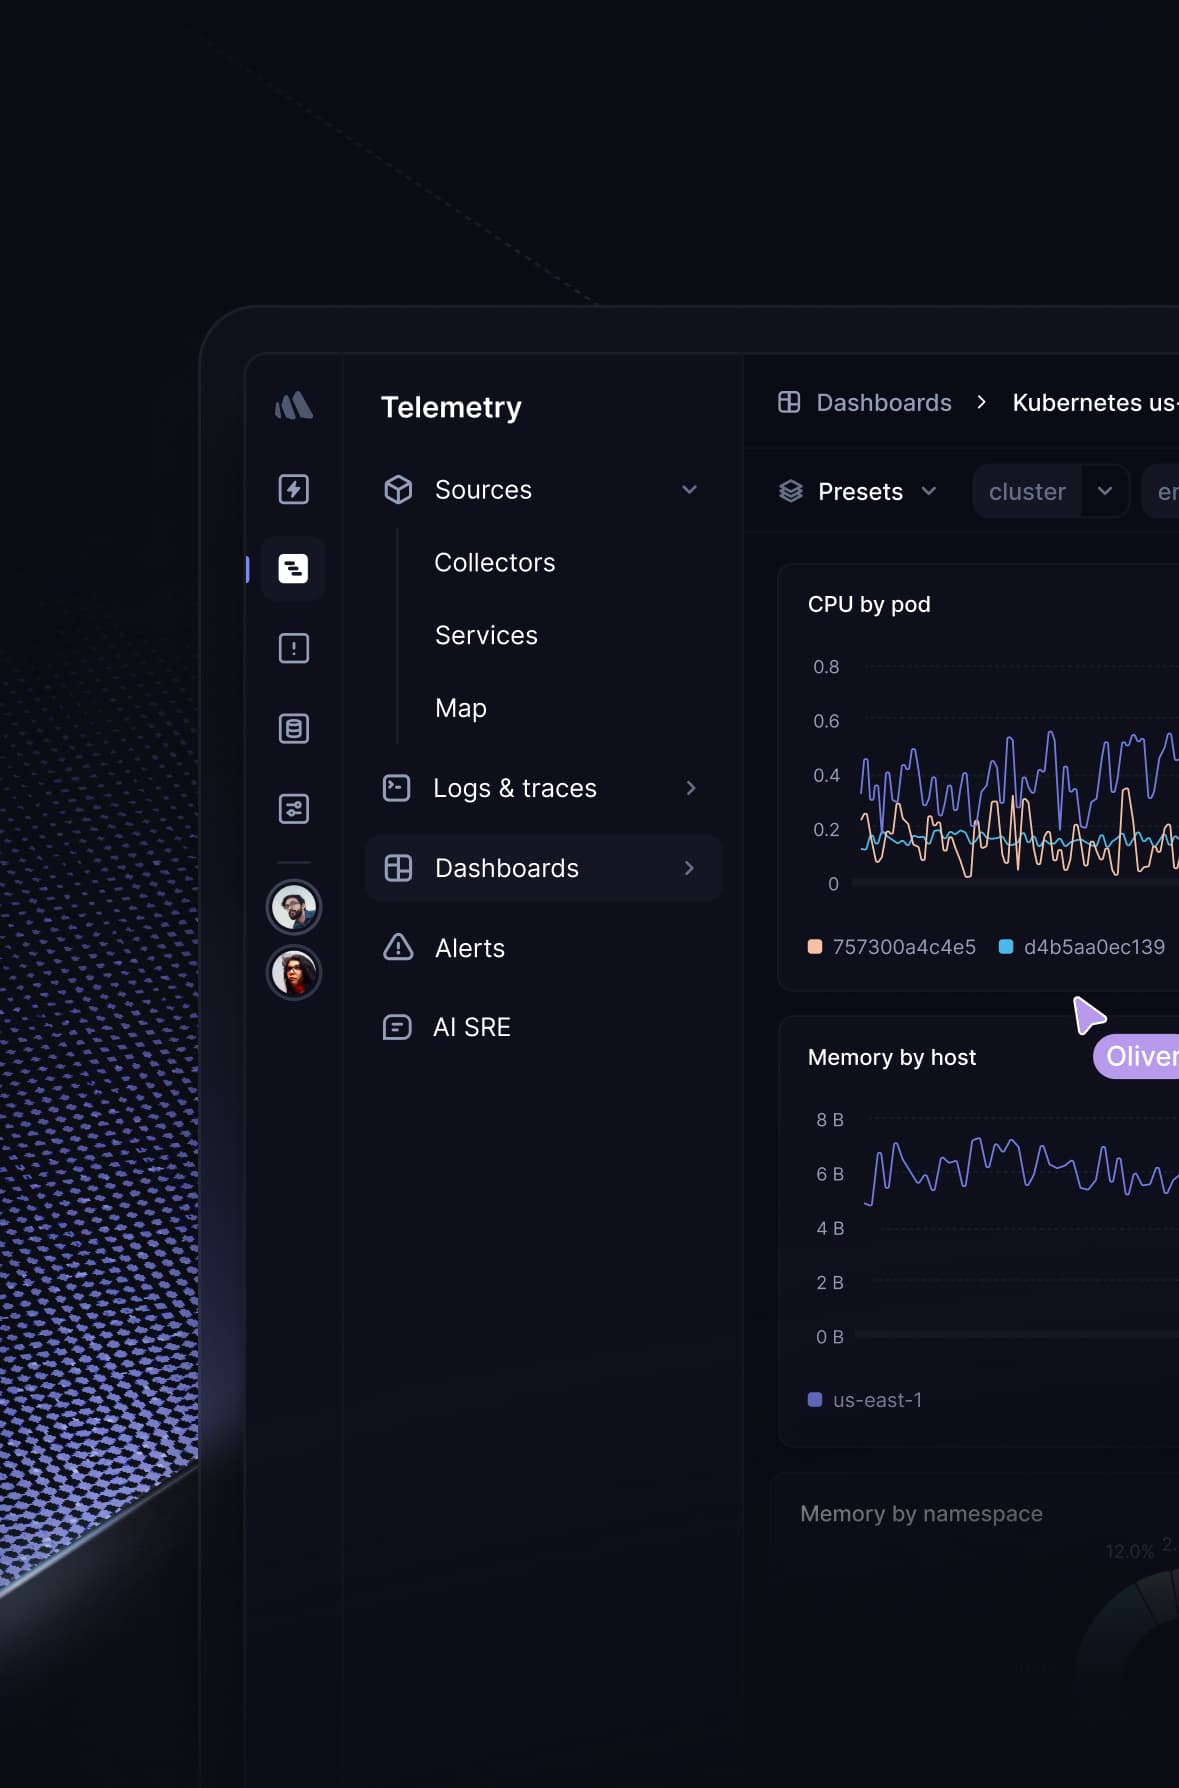
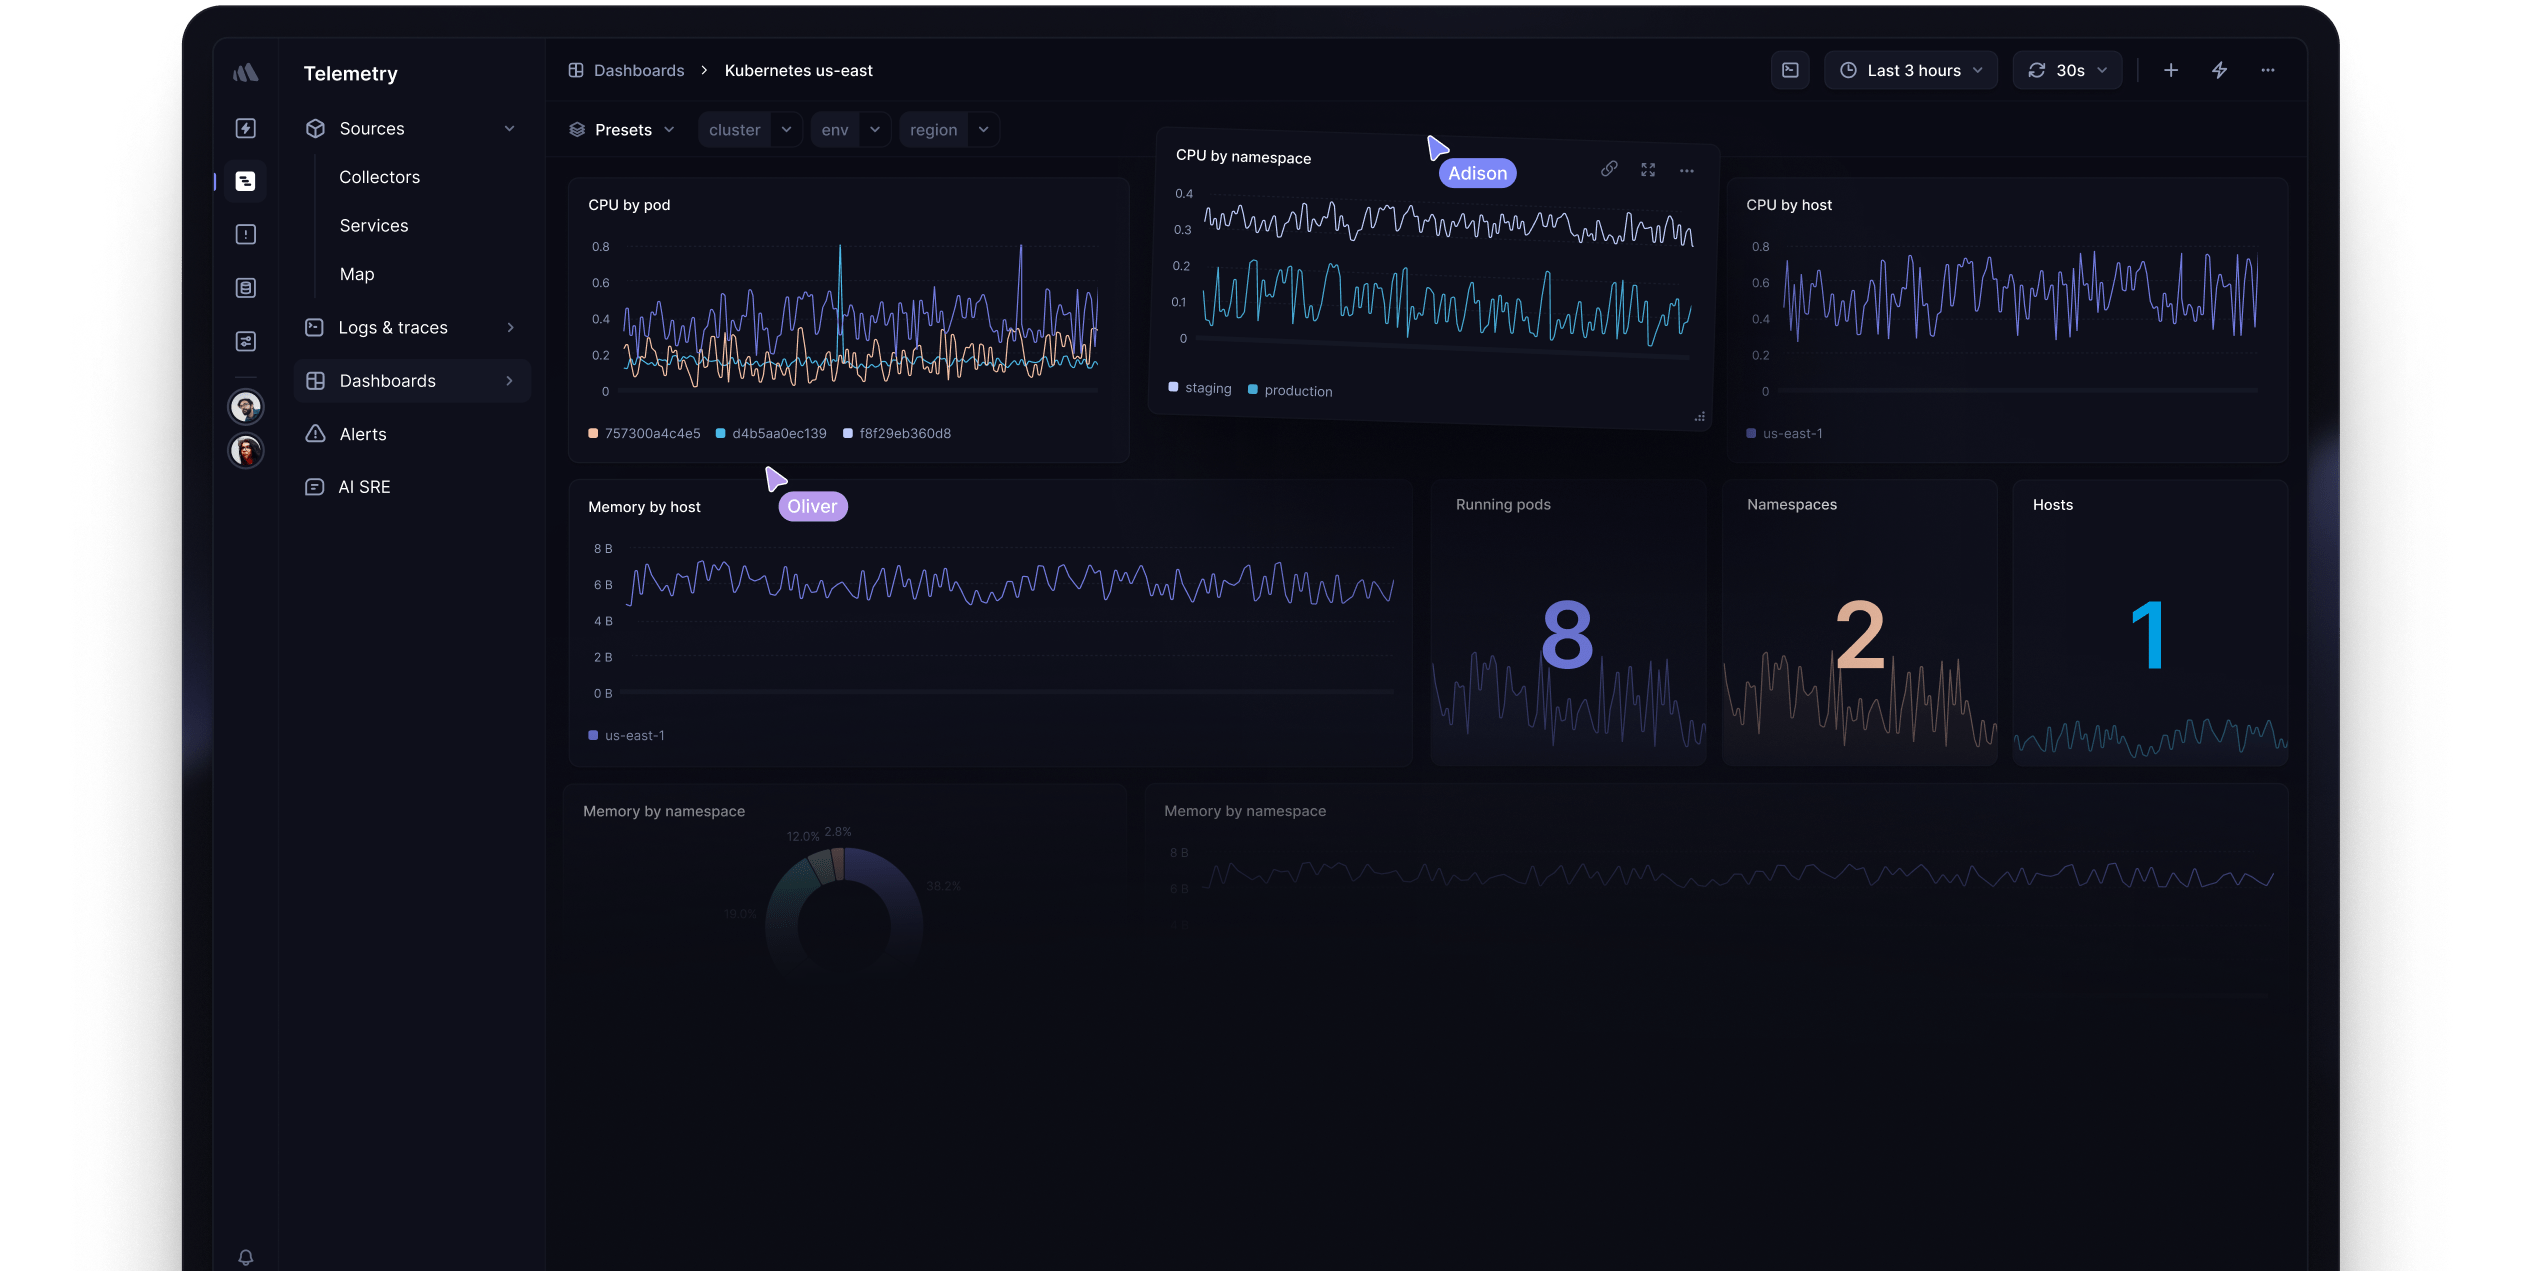
Browse integrationsDashboards you're used to
Use one of the many ready-made dashboards or create your own in just a few clicks.
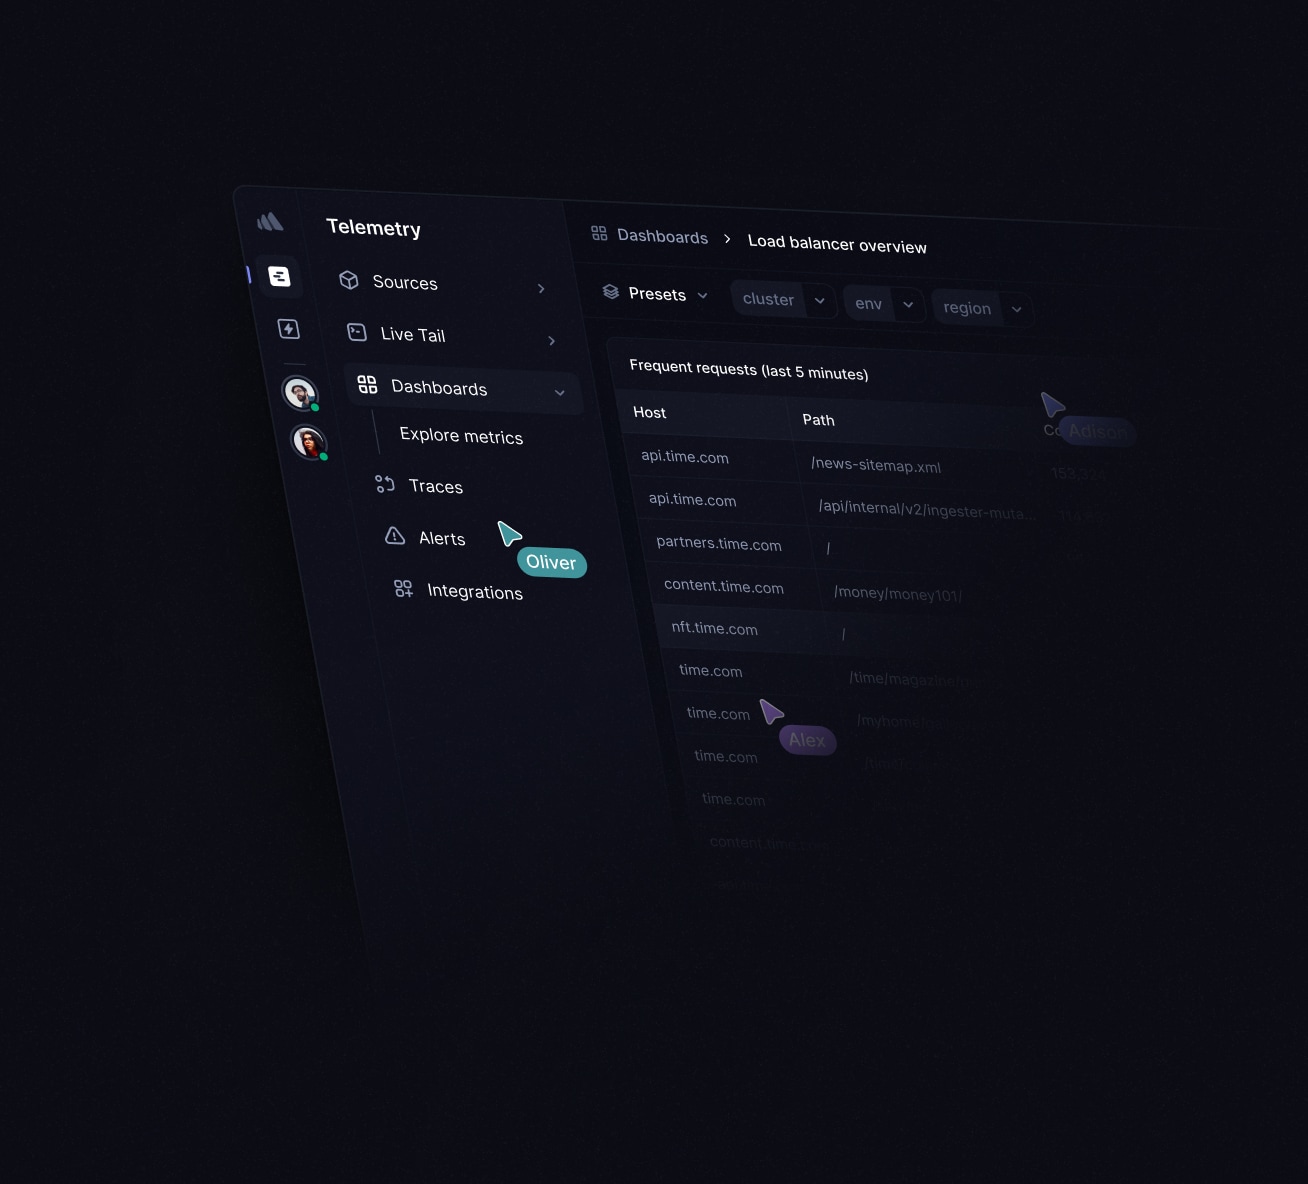
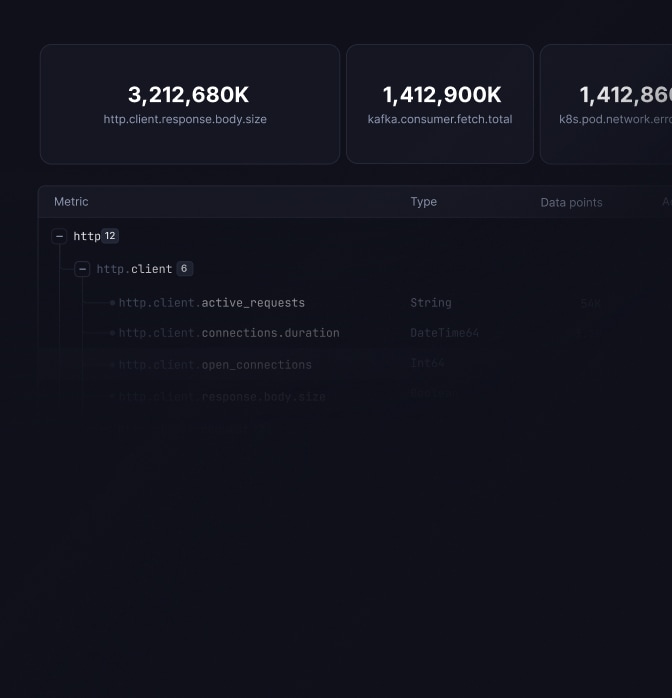
Single pane of glass
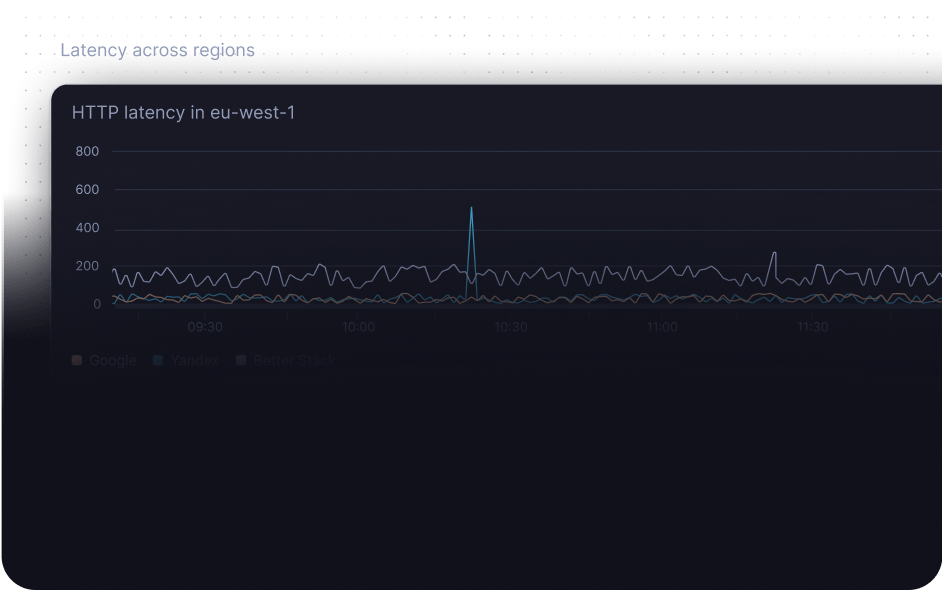
Query metrics across months of data from hundreds of clusters in seconds. Slice and dice your data to find issues at scale.
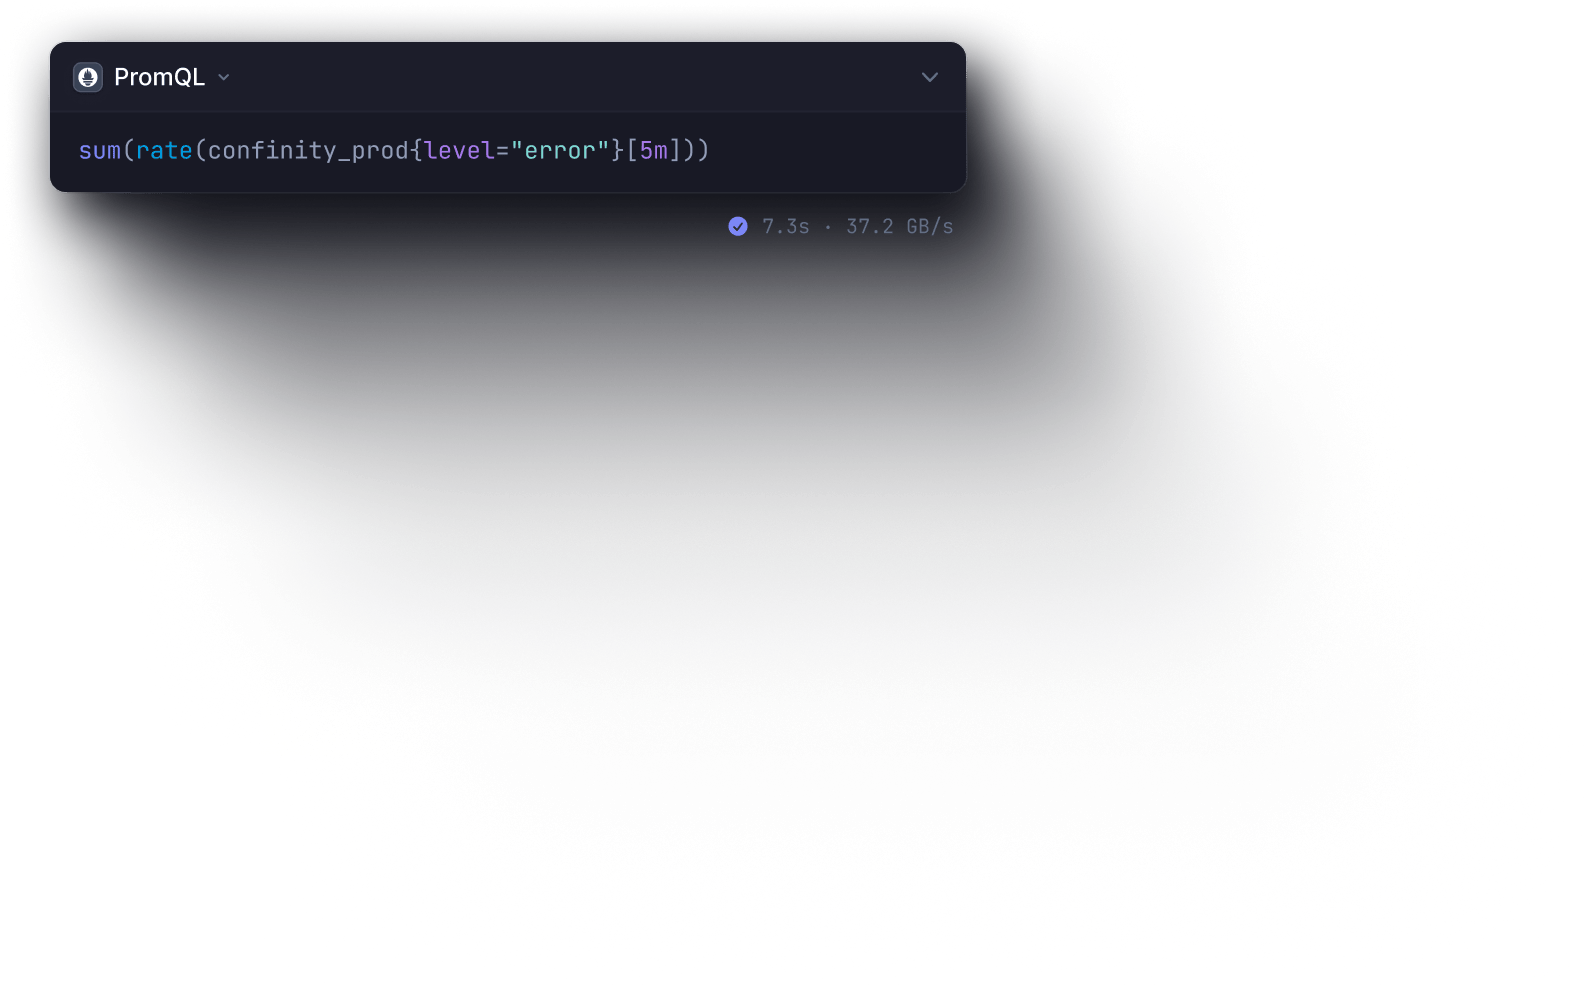
Query with Drag & drop, PromQL or SQL
Get answers fast with a powerful SQL query builder. No need to learn a new querying language or ask your data analyst.
Beautiful pre-built dashboards
Start in minutes with dashboard templates for the most popular services. Get actionable insights minutes after sending your first data.
Plays well with your self-hosted Grafana
No need to replace your existing Grafana on day one! Connect Better Stack as a Grafana source and enjoy an unmatched speed at a massive scale directly from your existing Grafana.
Everything you need to ship higher-quality software faster
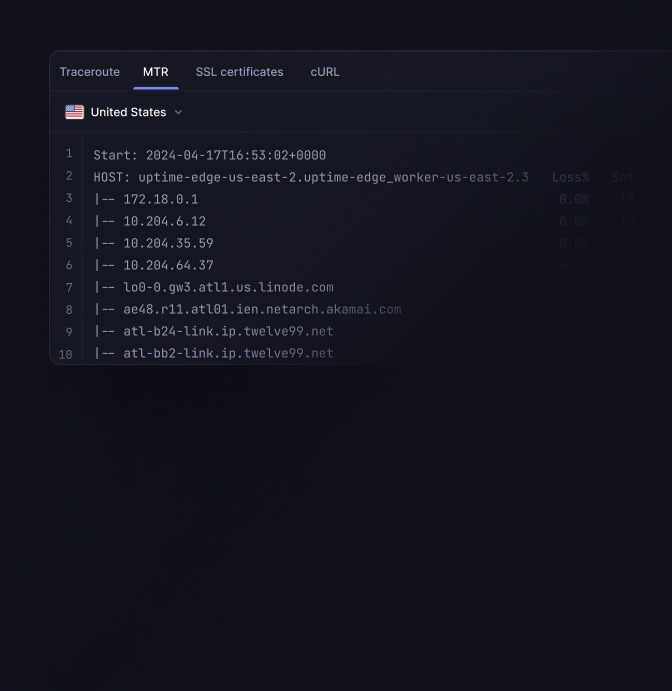
The most reliable uptime monitoring
Get a screenshot of the error and a second-by-second timeline with our fastest 30-second checks.
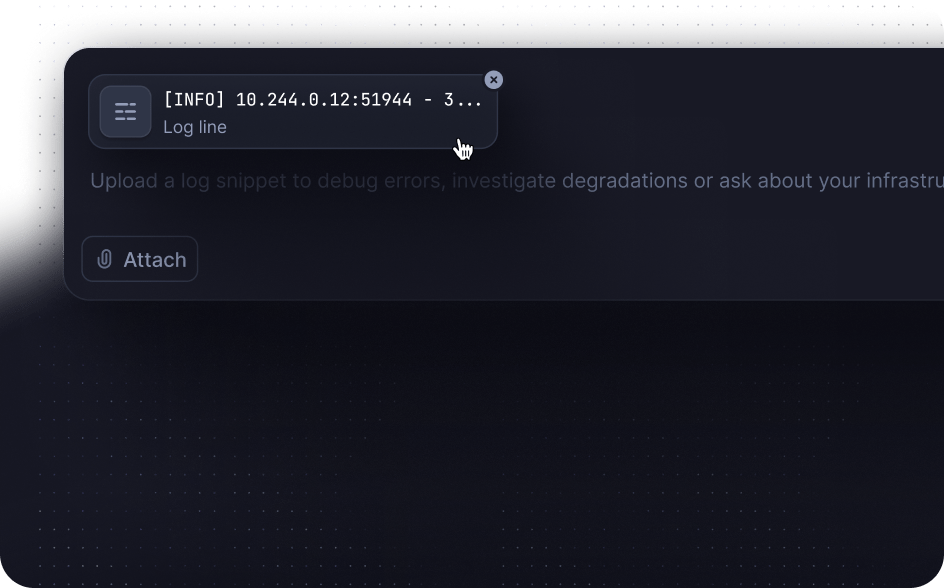
Log management
Collect logs across services with Vector, Syslog or OpenTelemetry with our reimagined log management.
Metrics
Integrate in minutes with Prometheus or OpenTelemetry, or create custom metrics directly from your logs.
Playwright checks
Run tests with a real Chrome browser instance with a JavaScript runtime.

Tracing
OpenTelemetry-native tracing with eBPF instrumentation.
Error tracking
Catch bugs, get root cause of every error, and create tickets on autopilot.
Happy customers, growing market presence
Ship higher-quality software faster. Be the hero of your engineering teams.
Looking for an enterprise solution? Book a demo
Please accept cookies
We use cookies to authenticate users, improve the product user experience, and for personalized ads. Learn more.