# New Relic vs SigNoz: A Complete Comparison for 2026
Most observability comparisons start with features. This one has to start with a fact that reframes everything after it: one of these two platforms you can download, run on your own servers, and operate for the cost of the infrastructure it sits on, with no license fee at all. **SigNoz is open source, and you can run the entire platform on your own servers for the cost of the infrastructure alone.** The entire backend, the APM, the trace explorer, the log search, the dashboards, all of it ships under a permissive license, and thousands of teams run it in their own clusters without ever talking to a salesperson. That single characteristic changes the shape of the decision more than any feature checkbox does.
New Relic sits at the other end of that spectrum. It is a mature, fully managed SaaS with a unified backend, a polished investigation experience, and a two-number pricing model built on data ingest and user seats. You do not run it, you do not scale its storage, and you do not patch it. **New Relic is a fully managed SaaS you never run, and you pay $349 per month for every engineer who needs full access.** For a small team that trade is often worth it. For a thirty-person engineering organization where everyone rotates on-call, the seat math produces a number that sends people looking at alternatives, and SigNoz is one of the first names that comes up.
But price is only the visible half of the difference. The deeper split is about ownership and operation. SigNoz is OpenTelemetry-native to its core, which means you instrument once with an open standard and keep the freedom to point that telemetry anywhere later. Your data can live entirely inside your own infrastructure. New Relic, by contrast, asks you to send everything to its cloud, hold it in NRDB, and query it with NRQL, a proprietary language that is genuinely good but ties every dashboard and saved investigation your team builds to the platform. Neither approach is wrong. They are answers to a different question: how much of your observability stack do you actually want to own and run yourself?
There is one more thing worth naming before the section-by-section breakdown, because it decides this comparison for a lot of teams. **SigNoz is focused observability: logs, metrics, traces, and the things adjacent to them.** **New Relic is a broad platform that also covers real user monitoring, session replay, synthetic testing, and a deep AI investigation layer that has been shipping for years.** If your requirements stop at backend telemetry, SigNoz's focus is a feature. If they extend to frontend experience and a full managed feature set, New Relic covers ground SigNoz does not attempt. The rest of this comparison is about where each of those bets pays off.
## Quick comparison at a glance
| Feature | New Relic | SigNoz |
|---|---|---|
| **Primary purpose** | Unified full-stack observability SaaS | Open-source, OpenTelemetry-native observability |
| **Deployment model** | SaaS only | Self-hosted (free), Cloud, BYOC, or enterprise self-hosted |
| **Open source** | No | Yes (permissive core, open-core enterprise module) |
| **Free option** | Free tier (100GB/month + 1 full user, forever) | Community edition (free, self-hosted, unlimited) |
| **Pricing model** | Per-user + data ingest (GB) | Usage-based (GB ingested + metric samples), no seats |
| **Per-user fees** | Yes ($349/month full platform, Pro) | No |
| **Per-host fees** | No (but seats gate access) | No |
| **Data ownership** | New Relic hosted | Yours (self-host or BYOC keep data in your cloud) |
| **Query language** | NRQL (proprietary, unified) | Query Builder + ClickHouse SQL + PromQL |
| **Storage engine** | NRDB | ClickHouse (hot/cold tiers) |
| **OTel support** | Yes (native, no surcharge) | Yes (native, the entire foundation) |
| **APM / distributed tracing** | Yes (agents, eBPF, thread profiling) | Yes (OTel-based, flamegraphs, trace funnels) |
| **Log management** | Yes (all searchable, $0.40/GB, no query fees) | Yes (ClickHouse full-text, live tail) |
| **Infrastructure monitoring** | Yes | Yes (hosts, K8s, containers, AWS/Azure/GCP) |
| **Exceptions monitoring** | Via APM / Errors Inbox | Yes (auto for Python, Java, Ruby, JS) |
| **Real user monitoring** | Yes (Gartner DEM Leader, 2x) | Web Vitals + mobile only |
| **Session replay** | Yes | No |
| **Synthetic monitoring** | Yes | No |
| **AI investigation** | SRE Agent (Preview), Applied Intelligence (GA) | Noz AI teammate (beta, Cloud only) |
| **MCP server** | Yes (Preview) | Yes (GA for Cloud, open source for self-host) |
| **AI / LLM observability** | Yes (AI Observability, GA June 2026) | Yes (LLM call tracing via OTel) |
| **Anomaly detection** | Yes (Applied Intelligence) | Yes (metrics, logs, traces, exceptions) |
| **Incident management** | Alerting + Applied Intelligence | Alerting only |
| **On-call scheduling** | Via New Relic On-Call or integrations | Not included |
| **Status pages** | No | No |
| **SOC 2 Type II** | Yes | Yes |
| **HIPAA** | Yes (Data Plus) | Yes |
| **Data residency** | Yes (US, EU) | Yes (US, EU, India; self-host is anywhere) |
| **FedRAMP** | Yes (Moderate, expanding to High) | No |
---
## Platform architecture and philosophy
The architectural gap here is wider than in most comparisons, because the two platforms disagree about who should run the software and where the data should live.
### New Relic: one hosted database, one query language, priced by who needs access

New Relic puts logs, metrics, traces, and events into NRDB and makes all of it queryable through NRQL. The investigation experience that follows is the whole pitch: an alert fires, and you click from the alert to the APM trace to the surrounding logs to the infrastructure state at that moment without switching interfaces or learning a second query syntax. Because everything shares one backend, the correlation is seamless and a new engineer can get productive quickly.
The pricing mirrors that unity in a specific way. OpenTelemetry is native with no surcharge, ingest runs $0.40/GB past the free tier, and the free tier itself (100GB per month and one full platform user, forever) is genuinely usable for a small team indefinitely. Beyond that, cost concentrates in seats: $349 per month for each full platform user on Pro. The model is easy to predict and easy to forecast, with one sharp edge. Every engineer who needs to investigate during an incident needs a seat, and seat cost compounds with headcount faster than any other factor in the bill.
### SigNoz: open source, OpenTelemetry-native, and yours to run
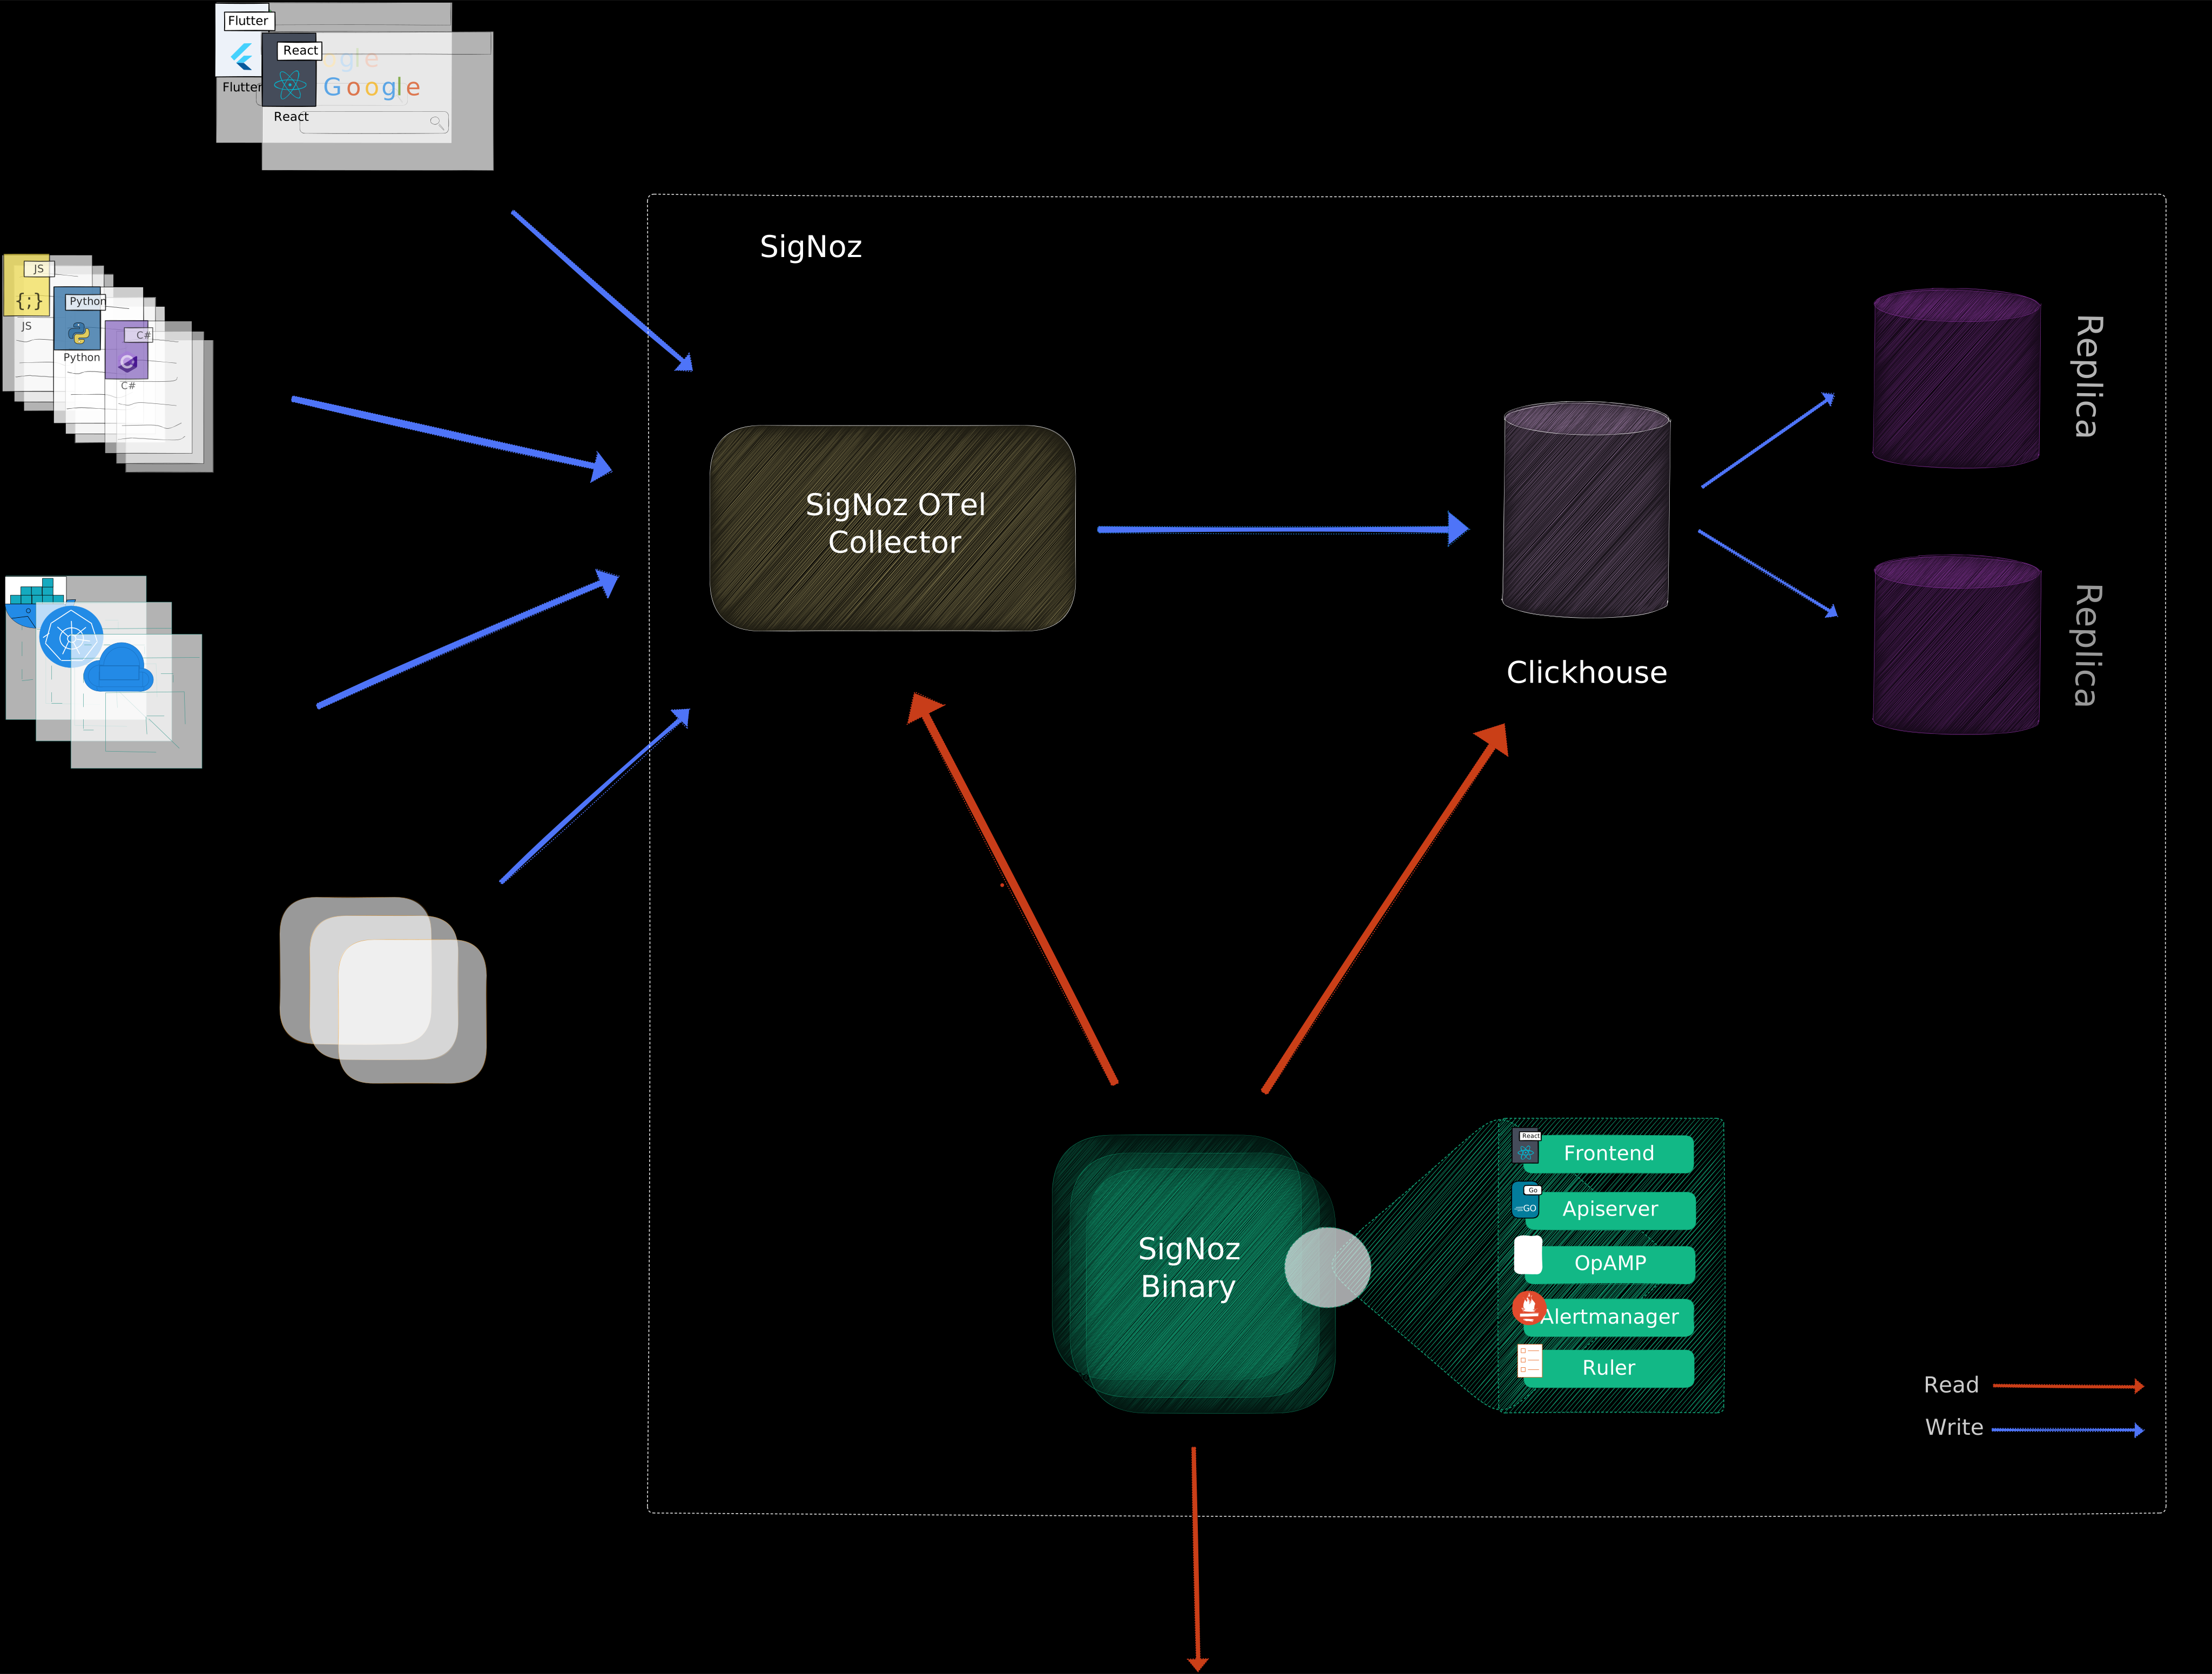
SigNoz is built on two decisions that define everything else. The first is OpenTelemetry as the only ingestion standard. There are no proprietary agents. You instrument with OTel SDKs, send data through the OTel Collector, and if you ever decide to leave, your instrumentation stays exactly as it is because it was never tied to SigNoz in the first place. The second decision is ClickHouse as the storage engine, the same columnar database Uber and Cloudflare use for high-volume workloads, which gives SigNoz fast queries across logs, metrics, and traces with hot and cold storage tiers for cost control.
What sits on top is a single workspace where logs, traces, metrics, exceptions, dashboards, and alerts stay connected. You move from a latency spike to the traces behind it, from a trace to its surrounding logs, from an alert to the service and attributes that triggered it, all without stitching tools together. Querying happens through a visual Query Builder for people who want it, or through ClickHouse SQL and PromQL for people who want raw power. None of it is a proprietary language you have to learn from scratch.
The deployment flexibility is the real headline. You can run the free Community edition on Docker, Kubernetes, or Linux and pay nothing beyond your own infrastructure. You can use SigNoz Cloud and let them operate it with usage-based pricing and no seats. Or, for enterprises with stricter requirements, you can run a dedicated cloud environment, a Bring Your Own Cloud deployment that SigNoz manages inside your account, or a fully self-hosted install with a support contract. The tradeoff is honest and worth stating plainly: self-hosting means you own the operational burden. You run ClickHouse, you scale it, you handle upgrades and retention, and at high volume that is real engineering work. SigNoz Cloud exists precisely so teams that want the ownership model without the operations can have it.
| Architectural factor | New Relic | SigNoz |
|---|---|---|
| Data storage | New Relic hosted (NRDB) | ClickHouse (self-hosted or SigNoz-managed) |
| Deployment | SaaS only | Self-host, Cloud, BYOC, enterprise self-host |
| Instrumentation | APM agents, eBPF, or OTel | OpenTelemetry only (no proprietary agents) |
| Query language | NRQL (proprietary) | Query Builder + ClickHouse SQL + PromQL |
| Data ownership | New Relic | You (self-host / BYOC keep data in your cloud) |
| Operational burden | None (fully managed) | Yours on self-host, none on Cloud |
| Cost pressure grows with | Engineer headcount + ingest | Data volume (no seats, no host fees) |
| Lock-in surface | NRQL + hosted data | Minimal (OTel in, open formats, SQL) |
[summary]
### The reliability layer that open source and per-seat SaaS both leave out
SigNoz keeps your telemetry and New Relic keeps your seats, but neither one closes the loop from a firing alert to the person who needs to wake up and the customers who need to be told. Better Stack folds on-call scheduling, phone and SMS escalation, incident timelines, and status pages into the same platform as your logs, metrics, and traces.
**One platform from the first heartbeat check to the closing post-mortem.** [Start free.](https://betterstack.com)
[/summary]
---
## APM and distributed tracing
Both platforms handle application performance monitoring well, and both treat OpenTelemetry as a first-class citizen. The difference is in instrumentation philosophy and how much depth you get without paying extra for it.
### New Relic: agent-based depth with eBPF and Infinite Tracing

New Relic offers language-specific APM agents that instrument at runtime, capturing thread-level CPU profiling that shows exactly which function is consuming cycles in production. Alongside those agents, eBPF-based eAPM provides zero-code Kubernetes instrumentation for services you cannot or would rather not touch. Infinite Tracing collects 100% of your traces and retains the most significant ones rather than sampling blindly, which matters for catching the rare slow request that random sampling would drop. APM 360 ties frontend sessions to backend traces inside one interface, and because RUM and APM share NRDB, that correlation needs no configuration. OpenTelemetry is supported natively with no surcharge, which is a real advantage over platforms that meter OTel data.
### SigNoz: OpenTelemetry tracing with flamegraphs, funnels, and no separate APM bill

SigNoz APM is built entirely on OpenTelemetry, and it turns your trace data into the metrics teams actually watch: p99 latency, error rate, Apdex, requests per second, plus database and external call performance, all derived automatically from spans. The trace explorer gives you flamegraphs, waterfalls, and span events to follow a single request across services down to the slow span. Trace funnels are a genuinely useful OTel-native touch: you build a funnel from your traces to see where multi-step request flows drop off, which failed transitions cluster, and where systemic workflow problems hide. There is no separate per-host APM charge layered on top, because APM is simply part of the telemetry you are already sending.
The honest tradeoff is instrumentation depth. New Relic's language agents reach thread-level and method-level detail that OTel auto-instrumentation, for all its portability, does not always match out of the box. For most services the OTel data is more than enough to find the bottleneck. For the deepest JVM or .NET performance-engineering work, New Relic's agents still go a layer deeper. What you trade for that depth is portability and cost, and for a lot of teams the OTel-native approach is the better bargain.
| APM / tracing | New Relic | SigNoz |
|---|---|---|
| Instrumentation | APM agents, eBPF (eAPM), or OTel | OpenTelemetry (SDKs + Collector) |
| Code-level profiling | Yes (thread profiling via agents) | Span-level (OTel auto-instrumentation) |
| Trace retention approach | Infinite Tracing (smart retention) | Configurable (15 days to 1 year) |
| Trace funnels | No | Yes (drop-off and failed-transition analysis) |
| OTel treatment | Native, no surcharge | Native (the entire foundation) |
| Frontend-to-backend | Seamless (shared NRDB) | Limited (Web Vitals, no deep RUM pivot) |
| APM pricing | Included in ingest + user license | Included in usage (no per-host charge) |
[summary]
### Tracing priced by volume, not by seat or host
New Relic charges for who gets to look, and self-hosting SigNoz means you carry the operational weight yourself. Better Stack's tracing is priced purely by the data you send, with no span-indexing fees and no cardinality penalties, and its AI SRE starts investigating root cause the moment an incident begins rather than waiting for you to ask.
**Full-fidelity distributed tracing from every service, billed by volume with nothing hidden.** [Explore Better Stack tracing.](https://betterstack.com/tracing)
[/summary]
---
## Log management
Both platforms make every ingested log searchable, which puts them ahead of the indexed-versus-archived model that causes so much bill shock elsewhere. The meaningful differences are where the data lives, what searching it costs, and how the two handle scale.
### New Relic: flat per-GB, no query fees, seven-year retention

New Relic charges $0.40/GB past the free tier, and every ingested log is searchable through NRQL with no per-query charge. Run fifty broad queries during an incident or five narrow ones and the bill is identical. There are no indexing decisions, no tier routing, and no archive to configure before the fact. Seven-year retention without rehydration covers compliance cases, AI alert summarization generates a hypothesis when a log-triggered alert fires, and cross-signal correlation works naturally because logs share NRDB with your traces and metrics.
### SigNoz: ClickHouse-speed log search with your data in your own cluster

SigNoz runs log management on ClickHouse, which is the same reason its queries stay fast at high volume. You get live tail for watching logs stream in, quick filters for narrowing quickly, and a query builder that also drops down to ClickHouse SQL when you need real analytical power. Logs sit on the same timeline as traces and infrastructure metrics, so correlation is a matter of clicking across signals rather than exporting between tools. Because ClickHouse handles structured and semi-structured data well, messy or evolving log formats do not require schema wrangling upfront.
The economics are where SigNoz gets interesting. On the self-hosted Community edition, your logs never leave your infrastructure and there is no ingest charge at all, only the storage and compute you are already paying your cloud provider for. On SigNoz Cloud, logs run $0.30/GB with the first $49 of monthly usage included, and retention beyond fifteen days adds a modest per-GB monthly cost, with retention options up to a year. Either way there is no query fee, no per-seat gate on who can search, and no penalty for keeping data in your own account. For a compliance-driven team sitting on years of logs, the self-hosted path in particular changes the math completely.
| Log management | New Relic | SigNoz |
|---|---|---|
| Ingest rate | $0.40/GB (100GB/month free) | $0 self-hosted, $0.30/GB on Cloud |
| All logs searchable | Yes | Yes |
| Query fees | None | None |
| Data location | New Relic hosted | Your cluster (self-host / BYOC) or SigNoz Cloud |
| Retention | Up to 7 years, no rehydration | 15 days to 1 year (configurable) |
| Storage engine | NRDB | ClickHouse (hot/cold tiers) |
| Query language | NRQL | Query Builder + ClickHouse SQL |
[summary]
### Log search without the indexing tax
New Relic makes all logs searchable but hosts them, and SigNoz hands you the search but also the servers to run it. Better Stack stores logs in a unified, ClickHouse-backed warehouse with SQL search and live tail, no per-event charges, and none of the operational work of running the database yourself.
**Unified log management with SQL search, live tail, and no indexing surprises.** [See how it works.](https://betterstack.com/logs)
[/summary]
---
## Infrastructure monitoring
Both platforms cover cloud infrastructure comprehensively. The differences come down to how access is gated and, again, where the data ends up.
### New Relic: broad cloud coverage, gated by the full platform seat

New Relic covers Linux, Windows, and macOS with agentless cloud integrations for AWS, Azure, and GCP, plus solid Kubernetes monitoring. Infrastructure data is included in the ingest-plus-seats model with no per-host fee. The consistent caveat applies here too: viewing infrastructure data during an incident requires a full platform seat, so an engineer without one provisioned cannot pull up host metrics at 2am. The data is there, but access is priced per person.
### SigNoz: OTel-based infrastructure monitoring across hosts, Kubernetes, and clouds

SigNoz monitors hosts, containers, and Kubernetes clusters, and its docs cover the major cloud services directly: EC2, ECS, EKS, Lambda, and RDS on AWS, VMs, AKS, and App Services on Azure, and GCE, GKE, and Cloud Run on GCP. Metrics arrive through OpenTelemetry, and SigNoz can also ingest from existing Prometheus setups, so a team already emitting Prometheus metrics does not have to re-instrument. The Metrics Explorer lets you build views with the visual builder or with PromQL and ClickHouse SQL, and every infrastructure metric can be correlated with the logs and traces from the same service on one timeline.
The access story is the mirror image of New Relic's. There are no seats, so every engineer at your organization can view infrastructure data without anyone paying for the privilege. On self-hosted deployments the metrics stay entirely inside your infrastructure. What SigNoz does not attempt is New Relic's breadth of managed integrations and the polish of an agentless setup that pulls thousands of cloud metrics with a few clicks. SigNoz asks you to wire up the OTel Collector, which is straightforward but is genuine setup work rather than a toggle.
| Infrastructure monitoring | New Relic | SigNoz |
|---|---|---|
| Pricing model | Included in ingest + user license | Included in usage (no seats, no host fees) |
| Access to view metrics | Full platform seat required ($349/month) | All users, no seat model |
| Cloud coverage | AWS, Azure, GCP (agentless) | AWS, Azure, GCP (via OTel + integrations) |
| Kubernetes | Yes | Yes |
| Prometheus ingestion | Supported | Native (reuse existing metrics) |
| Data in your account | No | Yes (self-host / BYOC) |
[summary]
### Infrastructure metrics wired into the whole reliability workflow
Both platforms tie infrastructure monitoring to either a seat model or the servers you run yourself. Better Stack charges no per-host fees and no cardinality penalties, and its infrastructure metrics sit next to uptime monitors, on-call schedules, and incident timelines rather than in a separate silo.
**Infrastructure monitoring connected to alerting, on-call, and incident response in one place.** [Get started free.](https://betterstack.com)
[/summary]
---
## AI capabilities
This is one of the more interesting sections, because both platforms have built serious agentic AI in the last year and both connect to coding agents through MCP, yet they arrive from opposite directions. New Relic layers AI onto a mature managed platform. SigNoz builds AI on top of an open, OTel-native foundation and leans into the idea that agents are now part of the team.
### New Relic: an "always on" SRE Agent, still mostly in preview

New Relic's SRE Agent, introduced in February 2026, is designed as an always-on teammate that begins diagnosing an incident before an engineer has even acknowledged the page. It queries traces, reviews logs, checks recent deployments, and produces a root cause hypothesis so the investigation is already underway by the time you open your laptop. Around it, the Agentic Platform adds a no-code builder for custom agents, a central orchestration layer, a built-in evaluation engine, and MCP support. Applied Intelligence, which groups related alerts and generates summaries, is generally available and has been for a while, and AI Observability for monitoring LLM pipelines and AI framework behavior reached general availability at New Relic's June 2026 event. The newest additions, Autopilot and Ground Truth, extend this toward a fully New Relic-operated SRE agent and toward giving your own agents direct access to New Relic data.
The honest caveat is maturity. The SRE Agent and much of the Agentic Platform remain in preview, and the MCP server is preview as well. The vision is coherent and the proactive trigger is a real advantage, but a team deciding today is buying against a preview for the flagship pieces.
### SigNoz: an MCP server, Agent Skills, and Noz on an agent-native foundation
SigNoz has leaned hard into what it calls agent-native observability, and the tagline on its own repository now describes it as a platform for your team and their AI agents. That shows up in two shipped pieces. The first is the hosted SigNoz MCP server, generally available for all Cloud users and runnable as open source for self-hosted teams, which connects Claude Code, Cursor, Codex, Gemini CLI, and other MCP-compatible agents to your telemetry so an engineer can go from alert to root cause to fix without leaving the terminal. The second is Noz, an in-product AI teammate that opens as a sidepane inside SigNoz. You ask it in plain English what changed after a deploy or why an endpoint is slow, and it works as an agent: it decides what to query, runs builder queries across traces, logs, and metrics, pulls representative examples, and reasons its way to a conclusion, showing each step it worked through. Noz can also build dashboards, alerts, and views on request. Rounding this out, Agent Skills are an open library of SKILL.md files that teach coding agents how to work with SigNoz without prompting.
Two honest limits matter. Noz is in beta, and it is available only on SigNoz Cloud, so self-hosted teams get the MCP server and Agent Skills but not the in-product teammate. And unlike New Relic's SRE Agent, Noz is something you invoke rather than something that fires autonomously the instant an alert triggers. For teams that want AI investigation to begin without a human in the loop, that trigger difference is real, and it currently favors New Relic's design even in preview.
| AI capability | New Relic | SigNoz |
|---|---|---|
| Autonomous investigation | SRE Agent (fires on alert, Preview) | Noz (you initiate, then agentic; beta) |
| In-product AI assistant | Via Agentic Platform (Preview) | Noz (Cloud only, beta) |
| MCP server | Yes (Preview) | Yes (GA for Cloud, open source for self-host) |
| Coding-agent skills | Ground Truth (summer 2026) | Agent Skills (open SKILL.md library) |
| Alert grouping / summaries | Applied Intelligence (GA) | Anomaly detection + alert history |
| LLM / AI observability | AI Observability (GA, June 2026) | LLM call tracing via OTel |
| No-code agent builder | Yes (Agentic Platform, Preview) | No |
| Self-hosted AI teammate | N/A (SaaS only) | No (Noz is Cloud only) |
[summary]
### AI that also gets someone on the phone
Both platforms can investigate, and both plug into coding agents. What neither includes is a direct line from a root cause hypothesis to an on-call notification, an incident timeline, and a status page update. Better Stack's AI SRE connects to the full incident lifecycle, so the investigation and the response happen in the same place.
**Autonomous root cause investigation wired straight into on-call, incidents, and status pages.** [See the AI SRE.](https://betterstack.com)
[/summary]
---
## Digital experience monitoring
This section is short because it is asymmetric, and pretending otherwise would not help you decide. Frontend monitoring is a clear New Relic strength and a genuine SigNoz gap.
New Relic is a two-time consecutive Gartner Magic Quadrant Leader for digital experience monitoring, and the suite is broad: Browser RUM, Mobile RUM across iOS, Android, React Native, and Flutter, Session Replay, Synthetic Monitoring, Product Analytics, and Experiments. Because RUM and APM share NRDB, clicking from a slow user session to the backend trace that caused it takes no configuration.

SigNoz does cover the front end, but narrowly. It offers Web Vitals monitoring, tracking LCP, CLS, INP, and TTFB per URL, and mobile monitoring for iOS, Android, and Flutter. What it does not have is session replay, synthetic testing, or product analytics, and there is no seamless RUM-to-backend-trace pivot of the kind New Relic gets for free by sharing NRDB.

So the gap is one of depth rather than total absence. If you need serious digital experience monitoring, session replay for debugging user-reported issues, synthetic checks against critical flows, or the mature analyst-recognized suite, this is a decisive point in New Relic's favor and no backend pricing advantage closes it. If basic frontend performance signals are enough, or that work already lives in a dedicated tool, SigNoz's Web Vitals and mobile coverage may be all you need.
| Digital experience | New Relic | SigNoz |
|---|---|---|
| Browser RUM | Yes (Gartner DEM Leader, 2x) | Web Vitals only (LCP, CLS, INP, TTFB) |
| Mobile RUM | Yes (iOS, Android, React Native, Flutter) | Yes (iOS, Android, Flutter) |
| Session replay | Yes | No |
| Synthetic monitoring | Yes | No |
| Product analytics | Yes | No |
| Frontend-to-backend correlation | Seamless (shared NRDB) | Limited |
---
## Incident management and alerting
Both platforms are strong on detection and stop short of owning the full response lifecycle. Neither ships on-call scheduling or status pages as a default product.
New Relic's Applied Intelligence groups related alerts and generates AI-driven summaries, and SLO tracking watches error budgets. On-call scheduling comes through New Relic On-Call or an external integration, and phone or SMS delivery depends on that layer either way.

SigNoz alerts on any signal, with threshold, anomaly-detection, and Apdex-based rules across metrics, logs, traces, and exceptions. Anomaly detection learns normal behavior and flags deviations without manual threshold tuning, and alert history helps you tighten noisy rules over time. Notifications route to Slack, PagerDuty, Opsgenie, Microsoft Teams, email, or webhooks, with routing policies that send alerts to the right team based on labels like service, severity, or environment. What SigNoz does not include is the paging layer itself: no on-call rotations, no escalation policies, no phone or SMS delivery. That work lives in PagerDuty or Opsgenie.
Neither platform offers status pages, and neither closes the loop from a detected problem to a coordinated, customer-facing response on its own.
| Incident management | New Relic | SigNoz |
|---|---|---|
| Alert intelligence | Applied Intelligence (AI grouping, GA) | Threshold + anomaly + Apdex |
| Anomaly detection | Yes | Yes (metrics, logs, traces, exceptions) |
| Notification channels | Broad | Slack, PagerDuty, Opsgenie, Teams, email, webhooks |
| On-call scheduling | Via New Relic On-Call or external | Not included (external tools) |
| Phone / SMS delivery | Via New Relic On-Call or external | Via PagerDuty / Opsgenie |
| Status pages | No | No |
---
## Pricing comparison
The pricing gap here is the widest in this comparison, and it is driven by two variables at once: how many engineers need full access, and whether you are willing to run the platform yourself.
New Relic charges $349 per month per full platform user on Pro, plus $0.40/GB for ingest past the 100GB free tier. A team of fifteen engineers who all need investigative access during incidents pays $5,235 per month in seat fees before telemetry is counted. The bill is predictable, and it scales almost entirely with headcount.
SigNoz charges by data volume with no user fees at all. On SigNoz Cloud, logs and traces run $0.30/GB and metrics run $0.10 per million samples, with the first $49 of usage included in the $49 monthly base. On the self-hosted Community edition, there are no ingest fees whatsoever, only the cost of the infrastructure you run it on, which a typical production deployment puts somewhere in the low hundreds of dollars per month. Enterprise plans start at $4,000 per month for a dedicated cloud environment, a managed BYOC deployment, or self-hosting with a support contract, and there is a startup program at half price for early-stage companies.
**Scenario: 15 engineers needing full access, 500GB/month logs and traces, moderate metrics**
| Cost component | New Relic (Pro, annual) | SigNoz Cloud | SigNoz self-hosted |
|---|---|---|---|
| User licenses | $5,235/month (15 x $349) | $0 (no seats) | $0 (no seats) |
| Ingest (500GB, minus any free) | ~$160/month | ~$135/month (after $49 credit) | $0 (your infra) |
| Metrics | Included in ingest | ~$25/month | $0 (your infra) |
| Infrastructure to run it | N/A (managed) | N/A (managed) | ~$200-800/month |
| Operational effort | None | None | Real engineering time |
| On-call (5 responders, PagerDuty) | ~$245-415/month | ~$245-415/month | ~$245-415/month |
| **Estimated monthly total** | **~$5,640-5,810/month** | **~$405-575/month** | **~$445-1,215/month + ops** |
The gap is driven almost entirely by seats. Flip the scenario to a three-engineer team on the same data volume and New Relic drops to about $1,207 per month while SigNoz barely moves, because SigNoz's cost never tracked headcount to begin with. The self-hosted column looks cheapest on paper, and it can be, but the honest line item is the one that does not show up as a number: the engineering time to run ClickHouse well at scale. For teams that have that capacity, the savings are real. For teams that do not, SigNoz Cloud captures most of the pricing advantage without the operational tax.
One more contrast worth stating. New Relic's free tier, 100GB and one full user forever, is the most generous evaluation path in managed observability and lets a small team run at zero cost indefinitely. SigNoz's equivalent is more radical: the entire Community edition is free forever for as many users and as much data as your own hardware can hold. They are different kinds of free, and which one fits depends on whether you would rather manage a bill or manage a cluster.
| Pricing factor | New Relic | SigNoz |
|---|---|---|
| Free option | 100GB + 1 full user, forever | Community edition, free and unlimited (self-hosted) |
| Per-user fee | $349/month (full platform, Pro) | None |
| Ingest rate | $0.40/GB (100GB free) | $0 self-hosted, $0.30/GB Cloud |
| Unlimited users | No | Yes |
| Self-hosting | No | Yes (free) |
| Data in your own account | No | Yes (self-host / BYOC) |
| Operational burden | None | Yours on self-host, none on Cloud |
| Cost scales with | Engineer headcount + ingest | Data volume only |
[summary]
### Full-lifecycle reliability without a per-seat bill or a cluster to run
New Relic makes you pay per engineer, and self-hosting SigNoz makes you run the database. Better Stack consolidates logs, metrics, traces, on-call scheduling, incident management, and status pages into one managed platform with usage-based pricing and no per-seat fees.
**Fewer vendors, no seat math, and a single home for the whole reliability workflow.** [Talk to us.](https://betterstack.com)
[/summary]
---
## Security and compliance
Neither platform is a security product, but both carry the certifications enterprise procurement asks about, and there are differences worth knowing.
New Relic holds SOC 2 Type II, HIPAA on Data Plus, and FedRAMP Moderate with expansion to High underway, which matters for public-sector and defense-adjacent work. Its Security RX feature, in preview, correlates vulnerability findings with engineering context, but it is a correlation feature rather than a threat-detection or runtime-protection product.
SigNoz is SOC 2 Type II and HIPAA-compliant, with data centers in the US, EU, and India for residency requirements, and enterprise deployments add RBAC, SSO, and ingestion controls. Its most distinctive security-adjacent property is structural rather than a feature: on self-hosted and BYOC deployments, your telemetry never leaves your infrastructure at all, which sidesteps a whole category of data-residency and sovereignty concerns before they arise. What SigNoz lacks is FedRAMP authorization, so for federal procurement specifically, New Relic covers ground SigNoz does not.
| Security and compliance | New Relic | SigNoz |
|---|---|---|
| SOC 2 Type II | Yes | Yes |
| HIPAA | Yes (Data Plus) | Yes |
| FedRAMP | Yes (Moderate, expanding to High) | No |
| Data residency | US, EU | US, EU, India (self-host is anywhere) |
| Data stays in your cloud | No | Yes (self-host / BYOC) |
| RBAC / SSO | Yes | Yes (enterprise) |
---
## What each platform genuinely lacks
**New Relic gaps worth knowing:**
1. Seat costs at $349 per month per full platform user compound quickly with team size.
2. No open-source or self-hosted option, and no air-gapped deployment.
3. All telemetry lives in New Relic's infrastructure, with no customer-owned storage path.
4. NRQL is proprietary, so every dashboard and saved investigation is tied to the platform.
5. The SRE Agent, most of the Agentic Platform, and the MCP server remain in preview.
6. No status pages and no unlimited native on-call delivery.
7. No PCI DSS or ISO 27001 certification.
**SigNoz gaps worth knowing:**
1. No session replay, synthetic monitoring, or product analytics; frontend coverage is limited to Web Vitals and mobile monitoring.
2. No on-call scheduling, escalation policies, or phone and SMS delivery.
3. No status pages.
4. Self-hosting carries a real operational burden: you run and scale ClickHouse yourself.
5. Noz, the in-product AI teammate, is Cloud only and still in beta; self-hosted teams get the MCP server but not Noz.
6. No FedRAMP authorization for federal procurement.
7. OTel instrumentation depth does not always match New Relic's language agents for the deepest profiling.
8. No native security monitoring or SIEM.
---
## Final thoughts
The honest way to choose between these two is to answer three questions about your own situation before you compare a single feature.
The first is whether you want to run observability yourself. If your team has the appetite and the operational capacity to run ClickHouse, **SigNoz's Community edition gives you a genuinely capable, OpenTelemetry-native platform for the cost of infrastructure and nothing else, with your data never leaving your cluster.** That is a structural advantage New Relic cannot match, because New Relic is a managed SaaS by design. If you would rather not operate anything, that advantage narrows to SigNoz Cloud versus New Relic, which is a closer and more conventional comparison.
The second is the shape of your team. New Relic's cost is anchored to how many engineers need full access, so a large rotation gets expensive fast, while **SigNoz charges by data volume and never by seat, so every engineer can investigate without adding to the bill.** For a big engineering organization, that difference tends to dominate everything else in the total cost. For a two- or three-person team under 100GB a month, New Relic's forever-free tier is genuinely hard to beat and the seat math never bites.
The third is how much breadth you actually need. **New Relic is the broader platform by a wide margin**: a mature analyst-recognized DEM suite with session replay and synthetics, a more proactive AI investigation layer, and FedRAMP coverage all reach past what SigNoz offers, whose frontend story stops at Web Vitals and mobile monitoring. If your requirements reach into frontend experience or federal compliance, New Relic wins that ground outright. **If your requirements stay in logs, metrics, and traces, SigNoz's focus becomes a strength**, and its open foundation, no-lock-in instrumentation, and agent-native direction make it one of the most compelling open-source observability platforms available in 2026.
Run the pricing with your real numbers, be honest about your operational capacity, and let those three answers point the way. They will usually decide this long before a feature-by-feature checklist does.
[summary]
### One layer neither platform actually closes
Whether you rent New Relic or run SigNoz yourself, you still need separate tools for on-call scheduling, phone and SMS escalation, and customer-facing status pages. Better Stack brings all of that together with logs, metrics, and traces in one managed platform, with usage-based pricing and no per-seat fees.
**The full reliability lifecycle in one place. Start free, no credit card required.** [Try Better Stack.](https://betterstack.com)
[/summary]