# Dynatrace vs SigNoz: A Complete Comparison for 2026
Dynatrace and SigNoz made the same architectural bet and opposite commercial ones. Both platforms rebuilt observability around a single high-performance storage engine: Dynatrace on Grail, its proprietary schema-on-read data lakehouse, and SigNoz on ClickHouse, the open-source columnar database proven at Uber and ByteDance scale. Query everything, index nothing, correlate across signals. The architecture papers could almost be swapped.
The commercial models could not be further apart. **Dynatrace meters consumption across more than a dozen dimensions**, memory-GiB-hours for hosts, GiB ingested and GiB scanned for logs, pod-hours for Kubernetes, per-session charges for RUM, with a reported minimum commitment around $24,000/year and a rate card that takes a spreadsheet to model. **SigNoz charges for data volume, full stop**: $0.30/GB for logs and traces, $0.10 per million metric samples, unlimited users, starting at $49/month in cloud, or free forever if you self-host the open-source Community Edition. One platform prices every capability separately and asks you to forecast your own usage across all of them. The other has a pricing page you can read in a minute.
What you get for Dynatrace's money is real: OneAgent's auto-instrumentation depth is unmatched, Davis AI has been doing deterministic root cause analysis in production since 2017, Smartscape maps enterprise topology automatically, and the platform covers mainframes and SAP systems no open-source tool touches. What SigNoz offers instead is structural: OpenTelemetry-native from day one so your instrumentation is portable by definition, deployment anywhere including air-gapped, and a cost curve that doesn't punish you for having large-memory hosts or a curious team that queries its own logs. This comparison works through where each approach earns its keep.
## Quick comparison at a glance
| Feature | Dynatrace | SigNoz |
|---|---|---|
| **Primary purpose** | Enterprise observability + security platform | OpenTelemetry-native open-source observability |
| **Open source** | No | Yes (28k+ GitHub stars) |
| **Deployment** | SaaS (managed on-prem retired) | Cloud, self-hosted (free), enterprise self-hosted |
| **Free tier** | 15-day trial only | Yes (Community Edition, unlimited) |
| **Pricing model** | Consumption rate card (DPS, many dimensions) | Data volume only |
| **Per-seat fee** | None | None |
| **Minimum commitment** | ~$24,000/year reported | $49/month (cloud) |
| **Storage engine** | Grail (proprietary lakehouse) | ClickHouse (open source) |
| **Query language** | DQL | ClickHouse SQL + PromQL + Query Builder |
| **Instrumentation** | OneAgent (auto-inject) or OTel | OpenTelemetry (native, primary) |
| **Query fees** | Yes ($0.0035/GiB scanned, pay-per-query) | None |
| **APM / tracing** | Yes (PurePath, method-level) | Yes (OTel, multi-view explorer) |
| **Log management** | Yes ($0.20/GiB + retention + query fees) | Yes ($0.30/GB, no query fees) |
| **Infrastructure monitoring** | Yes (deep, incl. mainframe, SAP, VMware) | Yes (hostmetrics, K8s, cloud) |
| **Topology mapping** | Smartscape (automatic, real-time) | Service map (trace-derived) |
| **Session replay** | Yes ($4.50/1K sessions) | No |
| **Synthetic monitoring** | Yes (per-action pricing) | No |
| **Application security** | Yes (runtime protection + posture) | No |
| **CI/CD / DORA metrics** | Via integrations | Yes (included) |
| **AI root cause analysis** | Davis AI (deterministic, since 2017) | Noz assistant (beta, prompt-driven) |
| **MCP server** | Yes (GA, query costs apply) | Yes (hosted, GA, no query costs) |
| **SOC 2 Type II** | Yes | Yes |
| **HIPAA** | Yes | Yes (BAA add-on / Enterprise) |
| **FedRAMP** | Yes (Moderate) | No |
| **ISO 27001** | Yes | No |
| **Data residency** | Dynatrace cloud regions | US, EU, India + self-hosted anywhere |
| **On-call / status pages** | No | No |
---
## Platform architecture and philosophy
### Dynatrace: OneAgent, Grail, and Smartscape, metered by consumption

Dynatrace's architecture rests on three genuinely impressive pieces of engineering. OneAgent installs on each host, auto-discovers running processes, and injects monitoring code at runtime, no per-service instrumentation work, no SDK rollout project. Smartscape discovers and maps dependencies across the entire environment in real time, producing the topology graph that everything else builds on. Grail stores logs, traces, metrics, and events with schema-on-read querying through DQL, so there's no hot/cold storage management and no index configuration.
The consumption model prices each capability on its own meter. Full-Stack Monitoring runs $0.01 per memory-GiB-hour, about $58/month for an 8 GiB host and roughly $467/month for a 64 GiB database server. Kubernetes pods add $0.002/pod-hour. Logs cost $0.20/GiB to ingest, then either cheap retention with metered queries ($0.0035 per GiB scanned) or expensive retention ($0.02/GiB-day, roughly 28x more) with queries bundled. RUM, session replay, synthetics, and Application Security each carry their own rates. The rate card is transparent; the bill is not, because forecasting it means predicting consumption across many independent dimensions, and the pay-per-query model creates a dynamic worth naming plainly: **investigating an incident more thoroughly costs more money.**
### SigNoz: OpenTelemetry-first, ClickHouse-backed, deploy anywhere
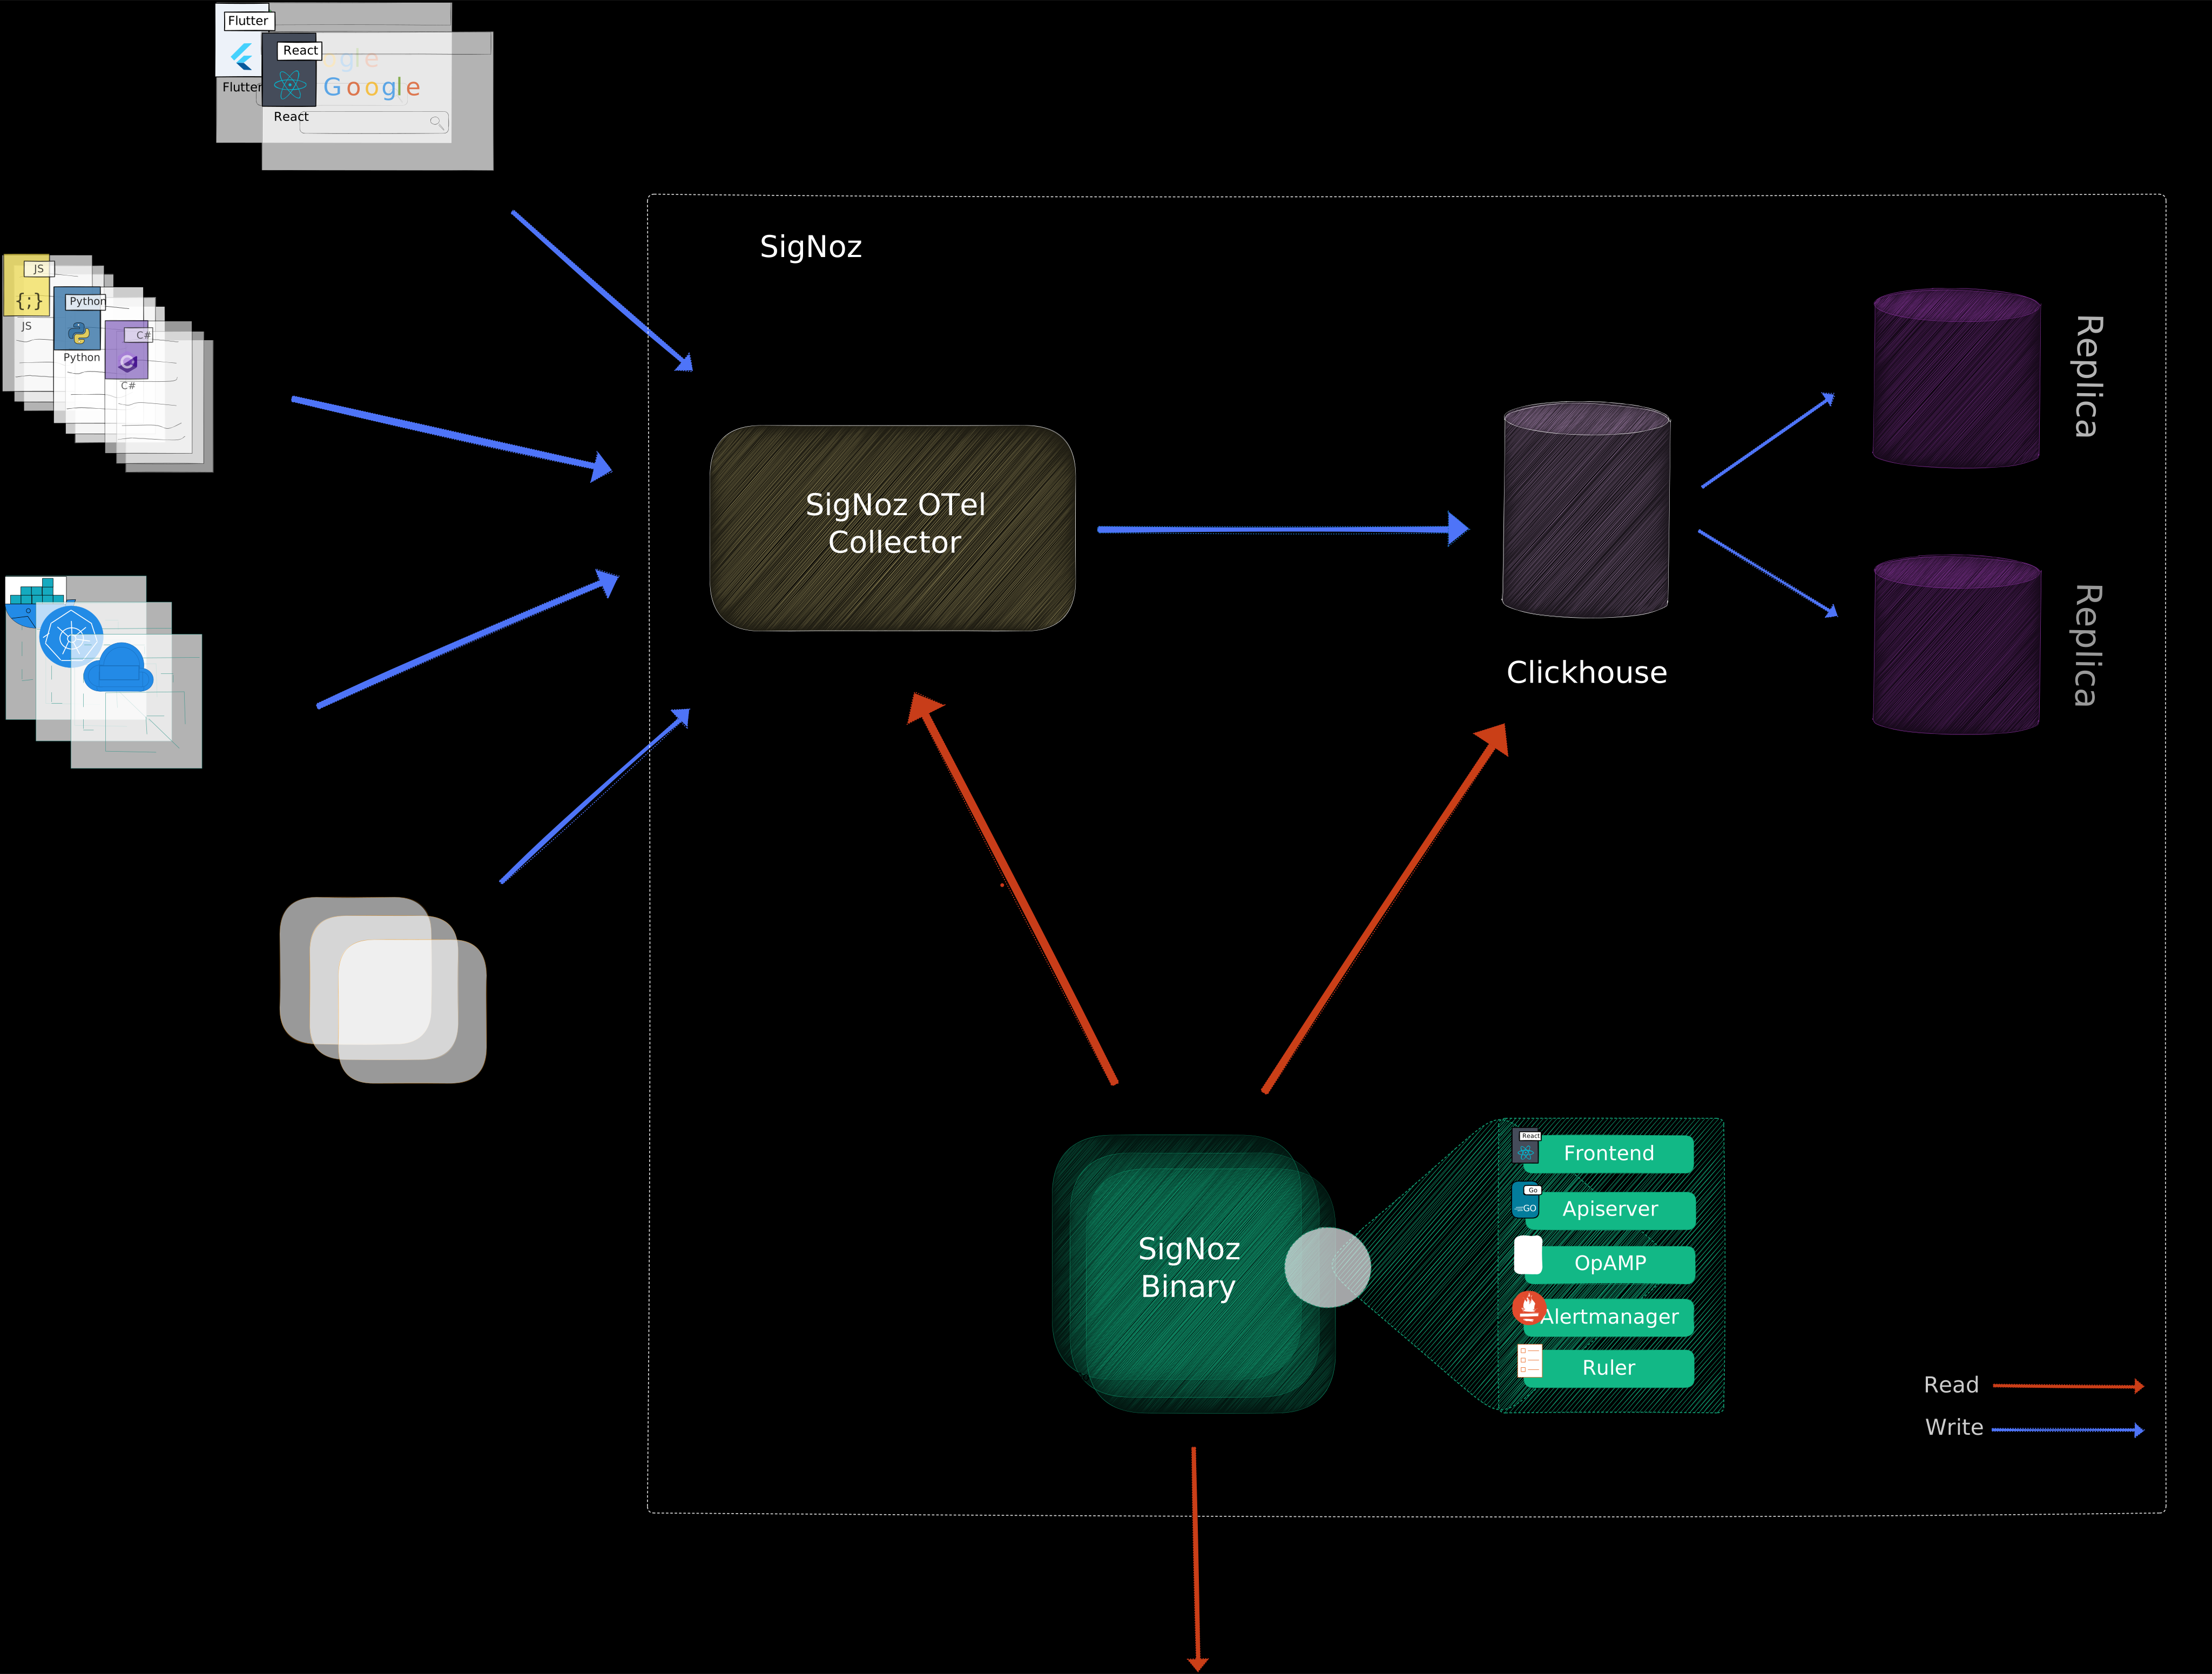
SigNoz was built to receive OTLP data from day one. The OpenTelemetry semantic conventions are the native data model, not a translation layer, so anything OTel can instrument, which by 2026 is nearly everything, feeds SigNoz without adapters. Storage is ClickHouse, with SigNoz demonstrating 10TB+/day ingestion in production deployments. Querying happens through a visual Query Builder, PromQL, or raw ClickHouse SQL for teams that want full analytical power, and there are no fees attached to any of it. Query as much as an incident requires.
Deployment is the structural differentiator. Run the free Community Edition on your own servers at any scale you can operate, use SigNoz Cloud with data centers in the US, EU, and India, or take the Enterprise path with dedicated environments or bring-your-own-cloud. Dynatrace retired its Managed on-premises offering, so for air-gapped and data-sovereign environments this comparison has one eligible vendor. And the exit cost asymmetry runs the same direction: leaving SigNoz means re-pointing OTel pipelines; leaving Dynatrace means replacing OneAgent instrumentation, Smartscape-dependent workflows, and DQL fluency your team spent a year building.
| Architectural factor | Dynatrace | SigNoz |
|---|---|---|
| Data storage | Grail (proprietary lakehouse) | ClickHouse (open source) |
| Query language | DQL | SQL + PromQL + Query Builder |
| Query fees | Yes (pay-per-query model) | None |
| Instrumentation | OneAgent (auto) or OTel (metered) | OpenTelemetry (native) |
| Topology | Smartscape (automatic) | Service map (trace-derived) |
| Self-hosted option | No (Managed retired) | Yes (free + Enterprise) |
| Lock-in risk | High (OneAgent, DQL, Smartscape) | Low (OTel standard, open storage) |
| Billing dimensions | Many | One (data volume) |
[summary]
### Neither platform covers the full reliability picture
Both platforms detect and analyze, then hand off. Neither includes built-in on-call scheduling with phone and SMS delivery or customer-facing status pages. Better Stack brings all of that together alongside logs, metrics, and traces, so you can go from alert to post-mortem without switching tools.
**From heartbeat monitoring to incident timelines to status pages, one platform for the whole reliability lifecycle.** [Start free.](https://betterstack.com)
[/summary]
---
## APM and distributed tracing
### Dynatrace: PurePath and the deepest auto-instrumentation available

Install OneAgent on a host and it discovers processes, injects monitoring code, and starts capturing PurePath traces that follow individual transactions from the browser through every service call and database query down to the specific method responsible for latency. For deep optimization work on JVM and .NET applications, the method-level flame graphs and thread contention analysis remain the benchmark for the category. Here's how trace analysis works in practice:
Two costs attach to that depth. The obvious one is money: Full-Stack Monitoring bills by host memory, and trace queries on the pay-per-query plan incur GiB-scanned charges. The subtler one is portability: PurePath data lives in Grail's format, OneAgent is the primary instrumentation path, and OTel data, while supported, counts toward metered consumption like everything else.
### SigNoz: OTel tracing with a capable explorer and no meters

SigNoz's Traces Explorer offers list, waterfall, time series, and table views, with aggregations (latency percentiles, rates, counts) across any span attribute including high-cardinality fields, at no extra indexing or query cost. Traces beyond 10,000 spans render without falling apart. Exceptions from OTel SDKs surface automatically in a dedicated tab, and third-party API monitoring tracks external dependency latency out of the box. What you give up against Dynatrace: instrumentation is your responsibility through OTel SDKs and the Collector, method-level profiling depth isn't there, and there's no equivalent of OneAgent walking onto a host and instrumenting everything by itself.
The practical trade: Dynatrace instruments your estate in an afternoon and charges you for every GiB of memory it touches forever. SigNoz asks for an OTel rollout upfront and then gets out of the way.
| APM / tracing | Dynatrace | SigNoz |
|---|---|---|
| Instrumentation | OneAgent (automatic) or OTel | OpenTelemetry (manual rollout) |
| Code-level profiling | Yes (PurePath, method-level) | No |
| Trace query fees | Yes (pay-per-query GiB-scanned) | None |
| High-cardinality querying | Yes (metered) | Yes (free) |
| Large trace rendering | Yes | Yes (10K+ spans) |
| OTel treatment | Supported, metered | Native, primary |
| APM pricing | $0.01/memory-GiB-hour | $0.30/GB traces |
[summary]
### Tracing priced by volume, investigated automatically
Dynatrace meters trace queries and SigNoz asks you to bring the questions. Better Stack's eBPF tracing is priced purely by data volume with no query fees and no host-size math, and the AI SRE activates automatically during incidents to investigate root cause before you have to ask.
**Full-fidelity distributed tracing from every service, priced by volume with no surprises.** [Explore Better Stack tracing.](https://betterstack.com/tracing)
[/summary]
---
## Log management
Both platforms run schema-on-read log storage with no upfront index configuration. The difference is what happens when you query.
### Dynatrace: topology-enriched logs with a two-model pricing puzzle

Dynatrace logs land in Grail at $0.20/GiB with DQL handling parsing and aggregation on read, and Smartscape topology enrichment adds genuinely useful context, a log line knows which service, host, and dependency chain it belongs to. Here's a walkthrough of the Logs app:
Then comes the plan decision. Pay-per-query: retention at $0.0007/GiB-day, queries at $0.0035/GiB scanned, cheap to store, expensive to be curious. Bundled: retention at $0.02/GiB-day, roughly 28x more, queries included. Teams must predict their own investigation patterns before signing, and the wrong guess costs real money every month.
### SigNoz: ClickHouse-fast, one price, query freely

SigNoz logs cost $0.30/GB with no query fees of any kind. Live tail, log pipelines for parsing, direct JSON filtering, saved views, and an OTel-aware UI that surfaces attribute hierarchies as first-class filters. Correlation to traces and infrastructure metrics comes free through shared OTel semantic attributes rather than through a proprietary topology engine. The constraint is retention: 15 days default, with longer-term and per-source custom retention still maturing. Dynatrace can retain logs up to 10 years; if compliance-grade retention is a hard requirement, that's a real gap.
| Log management | Dynatrace | SigNoz |
|---|---|---|
| Ingest rate | $0.20/GiB | $0.30/GB |
| Query fees | $0.0035/GiB-scanned or 28x retention | None |
| Upfront plan decision | Pay-per-query vs bundled | None |
| Default retention | Model-dependent | 15 days |
| Max retention | 10 years (usage-based) | Limited (custom retention in development) |
| Topology enrichment | Yes (Smartscape) | Via OTel attributes |
| Live tail | Yes | Yes |
---
## Infrastructure monitoring
### Dynatrace: the broadest coverage in the category

Dynatrace monitors cloud infrastructure and then keeps going where nobody else does: mainframes, SAP systems, VMware Tanzu, and hybrid data center estates spanning decades of infrastructure generations, all mapped automatically by Smartscape. Tiered modes (Foundation & Discovery at $7/month, Infrastructure at $29/month, Full-Stack at ~$58/month per 8 GiB host) let you match depth to criticality. The catch is the memory meter: Full-Stack pricing scales with host RAM, so dense modern hardware gets expensive fast, and cloud integrations pull in metrics by default that bill as custom metrics at $0.15 per 100k datapoints, a recurring source of surprise line items.
### SigNoz: OTel hostmetrics with DORA metrics included

SigNoz collects infrastructure metrics through the OTel Collector's hostmetrics receiver, tagged with standard semantic conventions so cross-signal navigation needs no configuration. Dashboards cover hosts, Kubernetes, and containers; cloud monitoring spans AWS, Azure, and GCP with single-click AWS integrations; pre-built dashboards exist for Redis, RDS, MongoDB, NGINX, and PostgreSQL. Metrics run $0.10 per million samples with no cardinality penalties and no custom-metric category at all. SigNoz also includes CI/CD observability with DORA metrics, deployment frequency, lead time, change failure rate, MTTR, which Dynatrace covers only through integrations. What it doesn't cover: mainframes, SAP, VMware. If those words appear in your architecture diagram, this section has one answer.
| Infrastructure monitoring | Dynatrace | SigNoz |
|---|---|---|
| Cloud hosts + Kubernetes | Yes | Yes |
| Mainframe / SAP / VMware | Yes | No |
| Host-size pricing | Yes (memory-GiB-hours) | No (volume only) |
| Custom metric charges | $0.15/100k datapoints | None |
| CI/CD / DORA metrics | Via integrations | Yes (included) |
| Topology mapping | Smartscape (automatic) | Service map + OTel attributes |
---
## Digital experience monitoring
This is Dynatrace's most one-sided section. Its DEM suite covers web and mobile RUM with crash analysis at $2.25 per 1,000 sessions, session replay at $4.50 per 1,000 sessions, browser synthetics at $4.50 per 1,000 actions, and HTTP monitors at $1 per 1,000 requests, all correlated to backend PurePaths so a slow user session connects directly to the method that caused it.

SigNoz offers Web Vitals monitoring (LCP, CLS, INP, TTFB per URL) and mobile monitoring for iOS, Android, and Flutter. No session replay, no synthetics, no product analytics.

Two honest footnotes. First, Dynatrace's per-session pricing deserves volume math before you commit: 5 million monthly sessions with replay run $22,500/month at list. Second, SigNoz punches back on one modern front: OTel-native LLM observability with Langtrace and OpenLLMetry integration and vector database monitoring via OpenLIT, in the same tool as your application traces.
| Digital experience | Dynatrace | SigNoz |
|---|---|---|
| Browser RUM | Yes ($2.25/1K sessions) | Web Vitals only |
| Session replay | Yes ($4.50/1K sessions) | No |
| Synthetic monitoring | Yes (per-action) | No |
| Mobile monitoring | Yes (with crash analysis) | Yes (iOS, Android, Flutter) |
| LLM observability | Via AI Observability features | Yes (OTel-native, OpenLIT) |
---
## AI capabilities
### Dynatrace: Davis AI, the most battle-tested root cause engine available
Davis AI predates the LLM era and works differently from the probabilistic assistants dominating the category. It runs deterministic fault-tree analysis across the Smartscape topology graph, collapsing cascading failures into a single problem with a traced causal chain, reproducible reasoning, in production since 2017. The agentic layer on top is maturing fast: Davis CoPilot (now evolving into Dynatrace Assist) converts natural language to DQL, an SRE Agent investigates alerts, and AutomationEngine wires detection to remediation workflows. The MCP server is GA in remote and local versions, with one caveat that fits the platform's pattern: MCP queries run against Grail and incur GiB-scanned charges, so AI-driven investigation is itself metered.
### SigNoz: MCP-first and developer-driven, with Noz in beta

SigNoz's hosted MCP server connects Claude, Cursor, Gemini, and other AI clients directly to traces, logs, metrics, and service topology, with no query fees attached, and Agent Skills stored as SKILL.md files let teams codify observability practices and share them through GitHub. Noz, the in-product assistant on the Teams plan, answers plain-English questions by populating the right Explorer view, but it's beta and prompt-driven: you bring the question. There's no deterministic root cause engine, no autonomous investigation, and nothing with Davis's production history.
The gap here is real and worth stating without hedging: for AI-driven operations at enterprise scale, Dynatrace is years ahead. SigNoz's counterpoint is narrower but genuine: its AI integration is free to use, GA, and doesn't charge you per GiB for letting an agent be thorough.
| AI capability | Dynatrace | SigNoz |
|---|---|---|
| Root cause engine | Davis AI (deterministic, since 2017) | No |
| Autonomous investigation | Yes (Davis + agentic layer) | No (Noz is prompt-driven) |
| Natural language querying | Davis CoPilot / Dynatrace Assist (GA) | Noz (beta) |
| MCP server | GA (queries metered) | GA (no query fees) |
| Codified agent skills | No | Yes (SKILL.md via GitHub) |
| Automated remediation | AutomationEngine | No |
[summary]
### AI that closes the loop from hypothesis to response
Davis is powerful but meters its own curiosity, and Noz waits for your prompt. Better Stack's AI SRE activates autonomously during incidents and delivers its root cause hypothesis into a live incident with the on-call engineer already paged, no query fees, no add-on pricing.
**Autonomous root cause investigation connected to on-call, incidents, and status pages.** [See the AI SRE.](https://betterstack.com)
[/summary]
---
## Pricing comparison
**Scenario: 100 hosts (8 GiB average), 20 engineers, 500GB/month logs, 300GB/month traces**
| Cost component | Dynatrace (DPS, list) | SigNoz (Cloud Teams) |
|---|---|---|
| Host monitoring (Full-Stack, 100 × 8 GiB) | ~$5,840/month | $0 (no host fees) |
| Base platform | $0 | $49/month (includes $49 usage) |
| Logs (500GB) | ~$100 ingest + $300-400 retention/queries | $150/month |
| Traces (300GB) | Allowance + metered queries | $90/month |
| Metrics | Included + custom metric charges | ~$30-60/month |
| User seats (20 engineers) | $0 | $0 |
| **Estimated monthly total** | **~$6,240-6,540/month** | **~$320-350/month** |
The gap is roughly 20x, and unlike the New Relic comparison where seats explain everything, here it's the host meter: Dynatrace's cost is anchored to infrastructure size and memory density, dimensions that only grow. Add the reported ~$24,000/year minimum commitment and the enterprise sales cycle, and Dynatrace's floor is higher than many teams' ceiling.
The stress test runs the other way too. Dynatrace's price buys OneAgent's zero-effort instrumentation, Davis, session replay, synthetics, runtime security, and mainframe/SAP coverage. If you need even two of those, the SigNoz column needs additional tools or engineering time added to it, and self-hosting the Community Edition trades subscription dollars for real operational work: ClickHouse capacity planning, upgrades, and on-call for your own observability stack. Free software is not free operations. The honest comparison is Dynatrace's bill against SigNoz's bill plus whatever your gaps cost to fill.
| Pricing factor | Dynatrace | SigNoz |
|---|---|---|
| Free tier | 15-day trial | Full product, self-hosted, unlimited |
| Cost anchored to | Host memory + consumption across dimensions | Data volume only |
| Query fees | Yes (logs, traces, MCP) | None |
| Minimum commitment | ~$24,000/year reported | $49/month |
| Startup pricing | No | $19/month program |
| Bill predictability | Requires consumption forecasting | One dimension |
| Self-serve start | No | Yes |
[summary]
### Volume pricing plus the incident layer both are missing
SigNoz proves observability doesn't need a consumption spreadsheet, but neither platform pages your on-call engineer or updates your status page. Better Stack combines volume-priced logs, metrics, and traces with built-in on-call scheduling, incident management, and status pages in one bill.
**Fewer vendors, fewer context switches, and a single place for the full reliability workflow.** [Talk to us.](https://betterstack.com)
[/summary]
---
## What each platform genuinely lacks
**Dynatrace gaps worth knowing:**
1. Consumption forecasting across many billing dimensions is genuinely hard; surprise costs from cloud metrics and query scanning are commonly reported.
2. Memory-based Full-Stack pricing penalizes large-memory hosts heavily.
3. Query fees mean thorough incident investigation, including by its own MCP-connected AI, carries a metered cost.
4. No free tier, no self-serve start, and a minimum commitment that excludes smaller teams.
5. The strongest proprietary lock-in in the category: OneAgent, PurePath, Smartscape, DQL.
6. No self-hosted option since Managed was retired.
7. Steep learning curve; G2 reviewers consistently flag onboarding difficulty.
8. No status pages and no native on-call with phone/SMS delivery.
**SigNoz gaps worth knowing:**
1. No session replay, synthetic monitoring, or product analytics.
2. No application security products and no runtime protection.
3. No deterministic root cause engine or autonomous AI investigation; Noz is beta and prompt-driven.
4. No code-level profiling comparable to PurePath.
5. No mainframe, SAP, or VMware coverage.
6. 15-day default log retention; compliance-grade retention still maturing.
7. No FedRAMP or ISO 27001; finer RBAC and audit logs marked coming soon.
8. Self-hosting shifts real operational burden onto your team.
9. No status pages and no native on-call with phone/SMS delivery.
---
## Final thoughts
The honest way to frame this decision: these platforms are rarely on the same shortlist for the same good reasons, and when they are, one of two things is true.
Either **you're an enterprise with the estate Dynatrace was built for, thousands of hosts, hybrid infrastructure, maybe mainframes and SAP, a security requirement**, and an operations culture that will actually use Davis's root cause engine, in which case **Dynatrace is worth its price and SigNoz can't cover the requirements list**. Budget honestly for the consumption model, negotiate the list rates (everyone does), and accept the lock-in as the cost of the depth.
Or you're an **OTel-committed engineering team that wants cost proportional to data, control over where telemetry lives, and the freedom to leave without a re-instrumentation project**, in which case **SigNoz delivers** 80% of the observability value at 5% of the cost, and the missing 20% is a specific list you can check against your actual needs. Session replay, synthetics, profiling, security, compliance retention: if none of those are in your critical path, the 20x price gap is buying the other side very little.
The trap to avoid is buying Dynatrace's depth and using SigNoz's slice of it. Plenty of teams pay for the full platform and use it as a tracing tool with dashboards, and at Dynatrace's rates, that's the most expensive way in the industry to do something an open-source tool does well. Match the tool to the estate, not to the analyst quadrant.
[summary]
### One thing neither covers: the full reliability layer
Neither Dynatrace nor SigNoz includes uptime monitoring, on-call scheduling with phone and SMS, incident management, and customer-facing status pages as a unified product. Better Stack brings all of that together with logs, metrics, and traces, with usage-based pricing and no per-host or consumption-dimension fees.
**The full reliability lifecycle in one place. Start free, no credit card required.** [Try Better Stack.](https://betterstack.com)
[/summary]