# Datadog vs Uptrace: A Complete Comparison for 2026
When engineers say they want to escape Datadog's bill, Uptrace is usually one of the first names that comes up. And for good reason: it is genuinely lean, genuinely cheap, and genuinely open-source. You can self-host the Community Edition for free, ingest traces, metrics, and logs with no per-host or per-seat fees, and use the exact same OpenTelemetry instrumentation you already have. **A small engineering team that just wants a clean APM backend without paying enterprise prices is the demographic Uptrace was built for.**
Datadog was built for something different. It is a broad observability and security platform that covers infrastructure monitoring, APM, log management, real user monitoring, digital experience, Cloud SIEM, and AI investigation in one integrated SaaS product. The investigation workflow is the whole value proposition: install one agent and everything flows into one system where you can click from an alert to a trace to the surrounding logs to the infrastructure metrics without switching interfaces. You pay significantly more for that, in ways that compound with every product you add.
**The comparison between these two is less about which platform does APM better and more about what you actually need to happen after the alert fires.** Uptrace sends you a Slack notification and stops there. Datadog has Bits AI SRE analyzing the incident before you open your laptop, an MCP server connecting your AI coding tools to your observability data, session replay, Cloud SIEM, and on-call scheduling via Datadog On-Call. Most of that is either unavailable in Uptrace or requires you to wire up external tools.
If you are evaluating Uptrace as a Datadog replacement, this article gives you the honest version of what you gain and what you give up.
## Quick comparison at a glance
| Feature | Datadog | Uptrace |
|---|---|---|
| **Primary audience** | DevOps, SRE, engineering, security | Engineering teams wanting cost-efficient APM |
| **Deployment model** | SaaS only | Cloud (Hetzner EU), self-hosted, on-premises |
| **Open-source / free tier** | No | Yes (Community Edition, AGPL; 50GB/month cloud free) |
| **Starting price** | $15/host/month (infra only) | $0.10/GB traces + $0.10/GB logs + $0.025/million metric datapoints |
| **Pricing model** | Per-host + per-GB + per-feature | Data volume only (no seats, no hosts) |
| **Hard budget cap** | No | Yes (Uptrace drops data rather than overcharging) |
| **Custom metric surcharges** | Yes | No |
| **Storage backend** | Proprietary | ClickHouse |
| **OTel support** | Partial (custom metric surcharge) | OTLP-only (exclusive, no proprietary agent) |
| **APM / distributed tracing** | Yes (primary strength) | Yes (primary strength) |
| **Log management** | Yes (two-tier billing) | Yes (ClickHouse-backed, all logs searchable) |
| **Infrastructure metrics** | Yes | Yes |
| **Real user monitoring** | Yes (browser + mobile) | No |
| **Session replay** | Yes | No |
| **Error tracking** | Yes | Basic (within traces) |
| **Synthetic monitoring** | Yes | No |
| **AI SRE** | Yes (Bits AI SRE, autonomous, GA Dec 2025) | No |
| **MCP server** | Yes (Preview) | No |
| **Cloud SIEM / security** | Yes | No |
| **Incident management** | Yes (seat-based add-on) | No (external tools only) |
| **Status pages** | No | No |
| **On-call scheduling** | Via Datadog On-Call or external | Not included |
| **Self-hosted option** | No | Yes (free Community Edition) |
| **Air-gapped / on-premises** | No | Yes (from $1,000/month managed) |
| **Grafana compatibility** | Limited | Yes (Tempo + Prometheus datasource) |
| **SOC 2 Type II** | Yes | On request (on-premises customers) |
| **GDPR** | Yes | Yes (EU data centers, Germany + Finland) |
| **HIPAA** | Yes | No |
| **FedRAMP** | Yes (GovCloud) | No |
---
## Platform architecture and philosophy
These two platforms are built from opposite assumptions about what an observability tool's job is.
### Datadog: proprietary SaaS with tight cross-signal integration

You install the Datadog Agent on every host, everything flows into Datadog's hosted infrastructure, and the investigation workflow is designed around seamless cross-signal navigation. When an alert fires, you can click from the alert to the APM trace to the surrounding logs to the infrastructure metrics without switching interfaces or changing query languages. Datadog controls the full pipeline from collection to storage to query, and that control is what makes the investigation experience feel coherent.
The cost for that coherence stacks: per-host pricing for infrastructure, another per-host charge for APM, per-GB plus per-million-event billing for logs, high-water mark billing that sets your monthly rate at your peak host count, and custom metric surcharges if you use OpenTelemetry.
### Uptrace: OTel-native APM on ClickHouse, designed to be simple and cheap

Uptrace's architecture is narrower by design. It accepts data exclusively via OTLP, stores everything in ClickHouse alongside PostgreSQL for metadata, and surfaces it through a unified trace, metric, and log interface. There is no proprietary agent to maintain and no vendor-specific SDK to install beyond standard OTel libraries.
The v2.0 release brought JSON-based span storage in ClickHouse that enables 5 to 10x query performance improvements, multi-project support through the UI, and real-time data transformations that let you enrich or filter incoming telemetry before it reaches storage. The compression is notable: a 1KB span compresses to roughly 40 bytes on disk, which is part of how Uptrace sustains its cost advantage.
The self-hosted Community Edition is genuinely free and fully featured under the AGPL license. You run ClickHouse, PostgreSQL, and the Uptrace server. No feature restrictions, no license fees. For teams with strict data residency requirements, this is meaningful. For teams that want someone else to manage the infrastructure, Uptrace Cloud runs in Hetzner's Germany data centers with redundant backups in Finland.
The hard budget cap is worth calling out specifically: you set a monthly ceiling and Uptrace guarantees it will never charge above it. If you hit the cap, it drops data rather than overcharging. Datadog has no equivalent. If you spike to 5x your normal traffic for a week, your bill spikes and the high-water mark billing means you pay the elevated rate for the whole month.
What Uptrace does not include: incident management, on-call scheduling, phone or SMS alerting, status pages, RUM, error tracking as a standalone product, an AI SRE, an MCP server, or session replay. These are not omissions in progress; they are out of scope by design. Uptrace is an APM, not a full operations platform.
| Architectural factor | Datadog | Uptrace |
|---|---|---|
| Data collection | Proprietary DD Agent | OTLP only (no proprietary agent) |
| Storage | Proprietary SaaS | ClickHouse + PostgreSQL |
| OTel support | Partial (custom metric surcharge) | Exclusive (OTLP-only ingestion) |
| Deployment | SaaS only | Cloud, self-hosted (free), on-premises |
| Hard budget cap | No | Yes |
| Open source | No | Yes (AGPL, Community Edition) |
| Data ownership | Datadog | Full (self-hosted option) |
[summary]
### Neither Datadog nor Uptrace covers the full reliability picture
Both platforms focus on telemetry and alerting. Neither includes built-in on-call scheduling with phone and SMS delivery or customer-facing status pages as part of the core product. Better Stack brings all of that together alongside logs, metrics, and traces, so you can go from alert to post-mortem without switching tools.
**From heartbeat monitoring to incident timelines to status pages, one platform for the whole reliability lifecycle.** [Start free.](https://betterstack.com)
[/summary]
---
## APM and distributed tracing
APM is where both platforms have genuine strengths, and where the comparison is most interesting rather than one-sided.
### Datadog: agent-based APM with the deepest tooling in the category
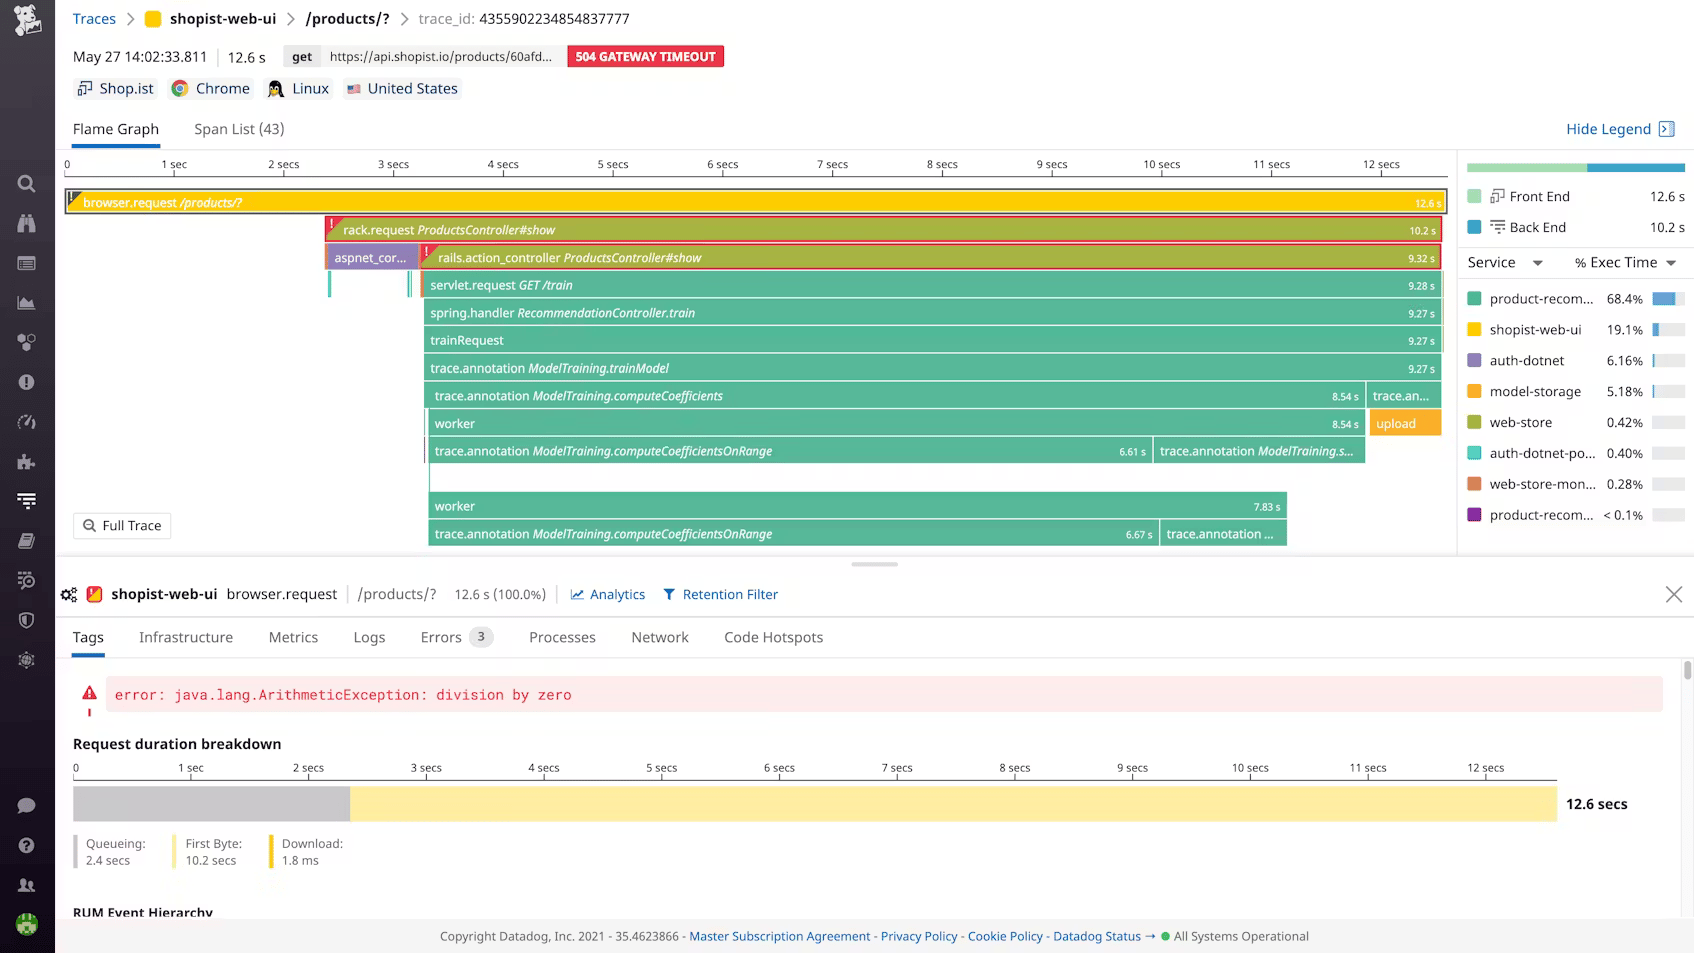
Datadog APM covers service maps, Continuous Profiler for code-level CPU and memory attribution, Dynamic Instrumentation for adding observability to production services without redeploying, and Watchdog for automatic anomaly detection. The frontend-to-backend correlation is seamless because RUM and APM share the same backend.
APM costs $31 to $40 per host per month on top of the base infrastructure fee. High-throughput microservices regularly exceed the 150 GB/1 million span per-host limits. If you use OpenTelemetry instrumentation, Datadog treats those metrics as custom metrics and bills accordingly.
### Uptrace: OTLP-native APM with fast ClickHouse-powered queries

Uptrace accepts data exclusively via OTLP, which is actually a stronger OpenTelemetry commitment than most commercial platforms make. There is no proprietary ingestion path. If you are already instrumented with OTel SDKs, Uptrace requires zero re-instrumentation. Switch from Datadog to Uptrace, and you update one config line in your OTel Collector rather than touching your application code.
The v2.0 JSON-based span storage enables queries against any span attribute without pre-indexing, which matters when you are doing ad-hoc investigation through high-cardinality trace data. Flame graphs, service maps with RED metrics (request rate, error rate, latency), and latency percentiles at p50/p90/p99 are all present. The iterative query builder lets you drill down step by step rather than writing a full query upfront.
The meaningful limitation: Uptrace has no eBPF-based path. Every service needs OTel SDK instrumentation to produce traces. In a greenfield environment where you control instrumentation from day one, this is fine. In an existing environment with dozens of services at different stages of OTel adoption, some services will have coverage gaps until someone instruments them. Datadog's agent instruments automatically regardless of application code.
Uptrace also does not include frontend APM. There is no RUM, no session replay, and no way to correlate a slow page load with the backend trace that caused it within Uptrace.
| APM / tracing | Datadog | Uptrace |
|---|---|---|
| Instrumentation | Proprietary SDK per service | OTel SDKs only (zero proprietary agent) |
| OTel support | Yes (custom metric surcharge applies) | Exclusive (no surcharge, OTLP-only) |
| Code-level profiling | Yes (Continuous Profiler) | No |
| Dynamic instrumentation | Yes | No |
| Frontend-to-backend correlation | Seamless (shared backend) | Not available |
| Flame graphs | Yes | Yes |
| Service maps | Yes (with RED metrics) | Yes (with RED metrics) |
| High-cardinality span queries | Yes | Yes (v2.0 JSON storage) |
| Self-hosted option | No | Yes (free Community Edition) |
| APM pricing | $31–$40/host/month (on top of infra) | $0.10/GB traces |
[summary]
### APM without the per-host bill
Both Datadog and Uptrace charge for APM differently, but both require code-level instrumentation. Better Stack's tracing captures distributed traces at the kernel level via eBPF, with no span indexing fees, no per-host charges, and no cardinality penalties, and the AI SRE activates automatically during incidents to investigate root cause before you have to ask.
**Full-fidelity distributed tracing from every service, priced by volume with no surprises.** [Explore Better Stack tracing.](https://betterstack.com/tracing)
[/summary]
---
## Log management
Both platforms store logs in ClickHouse-backed systems and make all ingested data searchable without a separate indexing tier. This puts them meaningfully ahead of Datadog's two-tier billing model where you pay to ingest and pay again to index.
### Datadog: excellent query experience, painful at scale
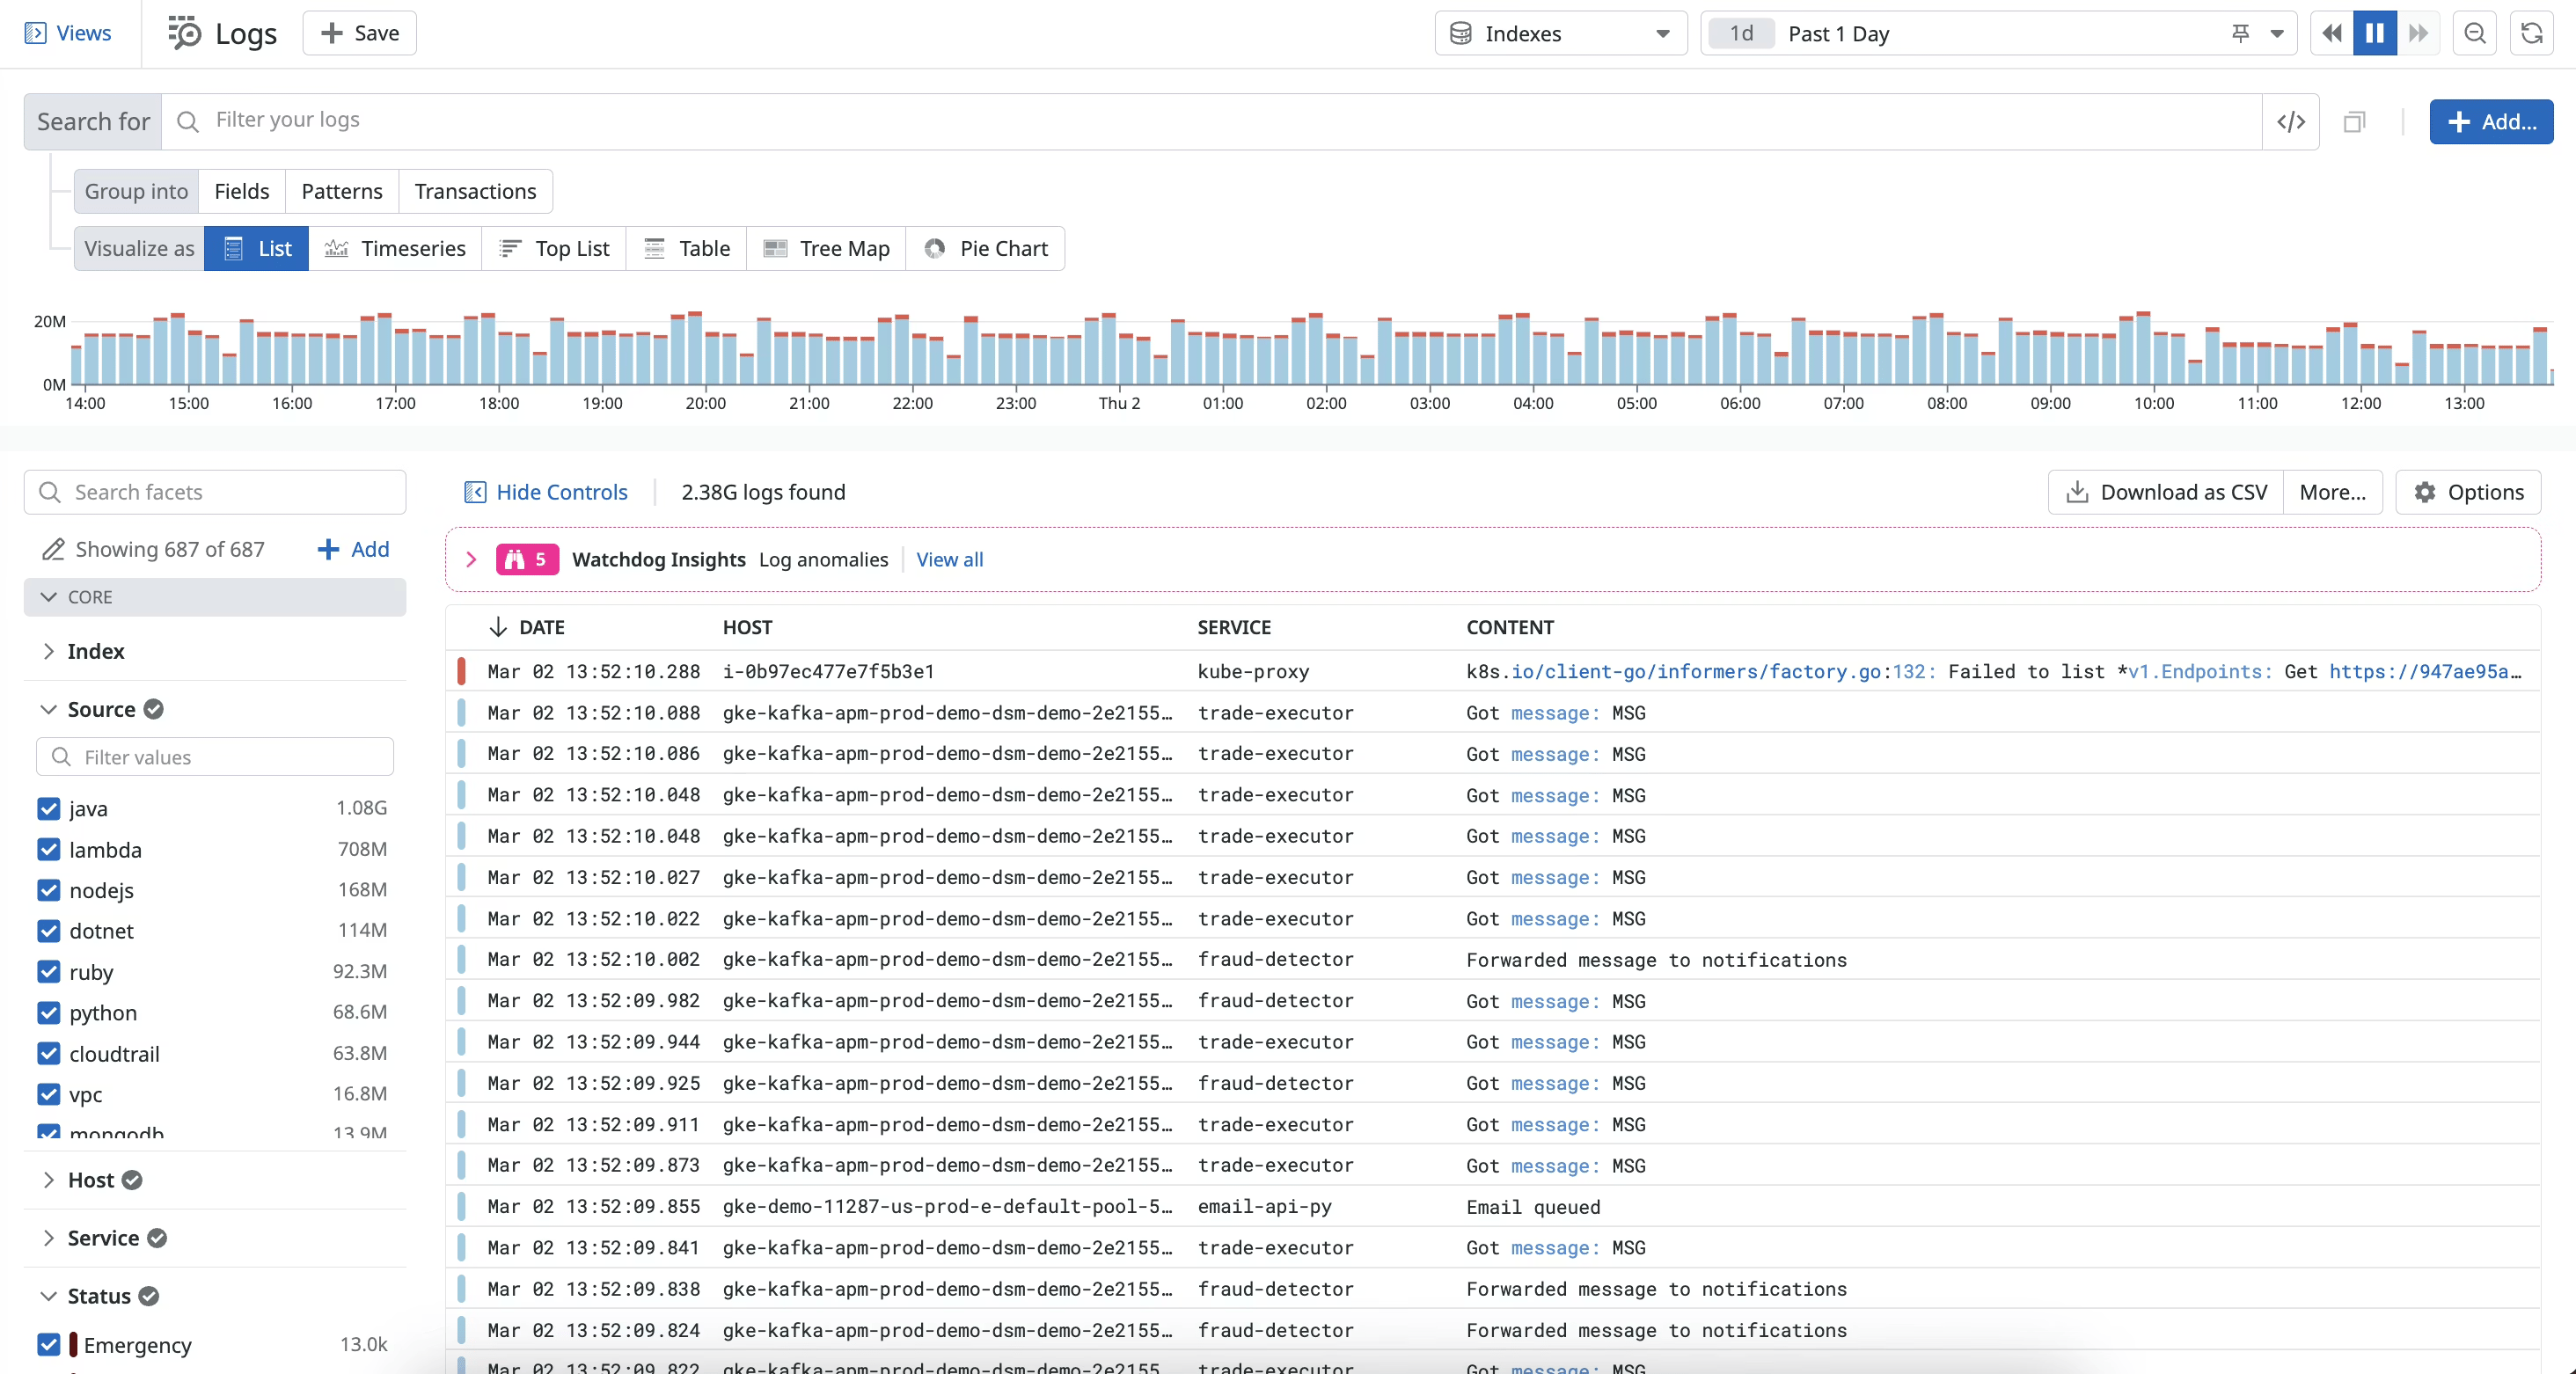
Datadog logs use two billing layers. You pay $0.10/GB for ingestion regardless of whether you ever query those logs. Then you pay $1.70 per million events to index them. Most teams ingest everything and index selectively, which means a portion of logs are always in archive and invisible without paying to rehydrate. At 100 GB/day, the Datadog log bill alone approaches $107,000 per year.
The query experience is excellent: faceted search, Log Patterns clustering, Sensitive Data Scanner, and seamless trace correlation because everything shares the same backend.
### Uptrace: all logs searchable, ClickHouse SQL throughout

Uptrace stores logs via OTLP ingestion and correlates them with traces automatically using OTel's standard context propagation. From any span, you can see the log events that occurred during that span's execution. Every ingested log is immediately queryable in ClickHouse SQL. There is no archive tier, no rehydration cost, and no decision about which logs to make searchable.
Log collection works with OTel SDKs, OTel Collector pipelines, Vector, and FluentBit. The v2.0 real-time data transformation layer lets you filter or drop logs at the ingestion layer before they reach storage, which is how you prevent a noisy dependency from spiking your bill overnight without touching application code.
The difference worth noting: Uptrace logs are queryable with ClickHouse SQL, which is powerful but specific. Datadog's log search, while proprietary, has a broader set of GUI-driven exploration tools. Whether that matters depends on how your team prefers to investigate. Engineers who are comfortable with SQL usually prefer Uptrace's model. Teams that rely heavily on point-and-click log exploration may find Datadog's interface more accessible.
| Log management | Datadog | Uptrace |
|---|---|---|
| Billing model | $0.10/GB ingestion + $1.70/million events indexed | $0.10/GB (cloud); free (self-hosted) |
| All logs searchable | Indexed subset only | Yes (all ingested logs) |
| Query language | Proprietary Log Search | ClickHouse SQL |
| Trace correlation | Seamless (shared backend) | Automatic (OTel context propagation) |
| Real-time ingestion filtering | Basic | Yes (v2.0 transformation layer) |
| Self-hosted logs | No | Yes (free) |
[summary]
### Log search with no indexing tax
Both Datadog and Uptrace handle logs differently, but only Datadog charges separately to make logs searchable. Better Stack stores logs in a unified warehouse with SQL querying, no indexing layer, and no per-event charges. You pay for what you send, and all of it is searchable.
**Unified log management with SQL search, live tail, and no indexing surprises.** [See how it works.](https://betterstack.com/logs)
[/summary]
---
## Infrastructure metrics monitoring
Both platforms handle Prometheus-compatible metrics with PromQL. Neither charges cardinality penalties. The differences are in pricing structure and what the metric data connects to.
### Datadog: comprehensive fleet visibility on a stacking per-host model

Datadog infrastructure monitoring starts at $15/host/month and is the foundation on which APM, database monitoring, and network monitoring all stack. Kubernetes monitoring is deep. Network Performance Monitoring tracks service-to-service traffic. Cloud Cost Management ties spending to infrastructure metrics. High-water mark billing means a five-day traffic spike sets your billing rate for the whole month, and OpenTelemetry metrics are treated as custom metrics with surcharges.
### Uptrace: datapoint-based metrics billing with no cardinality penalties

Uptrace bills metrics per million ingested datapoints rather than per GB or per host. Following an April 2026 pricing update (driven by Hetzner infrastructure cost increases), rates start at $0.025 per million datapoints. At the default one-minute collection interval, 1,000 timeseries over 28 days produces roughly 40 million datapoints, costing about $1.
You can reduce costs by setting longer collection intervals for non-critical metrics without any configuration overhead. The metric extraction feature lets you automatically derive metrics from log fields without pre-configuring extraction rules: any structured log field becomes a queryable metric.
Uptrace ships 50+ pre-built dashboards that activate when data starts flowing, covering Kubernetes, PostgreSQL, MySQL, Redis, Nginx, and other common stacks. The Grafana compatibility layer (Uptrace as a Tempo or Prometheus datasource) is useful for teams with existing Grafana dashboards: you can point those dashboards at Uptrace without rebuilding them.
Neither platform charges cardinality penalties. Adding high-cardinality tags like `customer_id` or `deployment_version` does not change your billing on either platform. This is a meaningful contrast to Datadog's custom metric surcharges when using OpenTelemetry.
| Infrastructure monitoring | Datadog | Uptrace |
|---|---|---|
| Pricing model | Per-host ($15–$23/month) | Per million datapoints ($0.025/million) |
| High-water mark billing | Yes | No |
| OTel metric surcharges | Yes (custom metrics) | No |
| Cardinality penalties | Yes (custom metrics) | No |
| Hard budget cap | No | Yes |
| PromQL support | Yes | Yes |
| Pre-built dashboards | Yes | Yes (50+, auto-created) |
| Grafana compatibility | Limited | Yes (Tempo + Prometheus datasource) |
| Self-hosted metrics | No | Yes (free) |
[summary]
### Infrastructure metrics connected to the full reliability workflow
Both Datadog and Uptrace handle infrastructure metrics with different pricing models and overhead. Better Stack takes a different approach: no per-host fees, no cardinality penalties, and infra metrics that live alongside uptime monitors, on-call schedules, and incident timelines.
**Infrastructure monitoring connected to alerting, on-call, and incident management, all in one place.** [Get started free.](https://betterstack.com)
[/summary]
---
## Pricing comparison
The pricing difference between these two platforms is real and large. But comparing them honestly requires understanding what each price covers.
### Datadog: multidimensional billing that compounds with every product you add

Infrastructure at $15 to $23 per host per month, APM at $31 to $40 per host per month on top of that, log ingestion at $0.10/GB, log indexing at $1.70 per million events, and custom metrics beyond the per-host allotment at $1 per 100. The high-water mark billing model means a traffic spike during your biggest week of the year sets your billing rate for the full month.

A 100-host deployment with APM, logs, and RUM commonly runs $20,000 to $30,000 per month.
### Uptrace: volume-based pricing with no seats, no hosts, no surprises
Uptrace pricing is simple: $0.10/GB for traces and logs, $0.025 per million metric datapoints. No per-host fees, no per-seat charges, unlimited users, unlimited services, unlimited hosts. The free tier on Uptrace Cloud gives you 50 GB of traces, logs, and metrics per month and 5,000 timeseries with no credit card required. The Community Edition on GitHub is free forever with no feature restrictions.
The hard budget cap is a meaningful feature for teams managing tight budgets: set a monthly ceiling and Uptrace drops data rather than billing above it. No equivalent exists in Datadog's billing model.
**Rough cost comparison: 100 hosts, 2.5TB/month combined telemetry**
| Cost component | Datadog (Pro, annual) | Uptrace Cloud |
|---|---|---|
| Infrastructure monitoring | $1,500/month | Included in volume pricing |
| APM | $3,100/month | Included in volume pricing |
| Log ingestion | $600/month | $100/month (1TB logs at $0.10/GB) |
| Log indexing | ~$3,000/month | Included (all logs searchable) |
| Metrics | Surcharges apply | ~$25/month (1B datapoints) |
| RUM | Separate SKU | Not available |
| Incident management (5 responders) | Via Datadog On-Call or PagerDuty | PagerDuty (~$245-415/month) |
| **Estimated monthly total** | **~$8,200+/month** | **~$370-785/month** |
The Uptrace number includes PagerDuty for on-call because without it you have no way to page anyone when an alert fires. Even with PagerDuty on top, the gap is significant. What it does not include is RUM, session replay, Cloud SIEM, Continuous Profiler, or an AI SRE, because Uptrace does not have those. If you need them, you are adding more external tools or moving back toward Datadog.
| Pricing factor | Datadog | Uptrace |
|---|---|---|
| Per-host fee | Yes ($15–$23/month) | No |
| APM on top of infra | Yes ($31–$40/host) | No (included in volume) |
| Log indexing fee | Yes ($1.70/million events) | No (all logs searchable) |
| Unlimited users | No | Yes |
| Unlimited hosts | No | Yes |
| High-water mark billing | Yes | No |
| Hard budget cap | No | Yes |
| OTel metric surcharges | Yes | No |
| Free tier | No | Yes (50GB/month cloud; self-hosted free) |
| Self-hosted option | No | Yes (free Community Edition) |
---
## AI capabilities
This is the category with the widest gap between the platforms, and it is structural rather than a matter of maturity.
### Datadog: autonomous AI investigation that fires before you open your laptop

Datadog's Bits AI SRE went GA in December 2025. When an alert fires, it starts investigating without anyone prompting it: querying traces, reviewing logs, checking recent deployments, producing a root-cause hypothesis. By the time you open your laptop, the investigation is already in progress. Beyond Bits AI SRE, there is Bits Chat for conversational queries, Bits Code for in-editor help, Bits Security Analyst for SIEM triage, and an MCP Server in Preview that lets Claude, Cursor, and other AI coding tools query your Datadog data directly.
For engineering teams that have moved toward AI-assisted development, the MCP server is not a minor convenience. It means asking "which services have elevated error rates in the last hour?" directly in your Claude Code or Cursor session rather than context-switching to the Datadog UI.
### Uptrace: alerting only, no AI investigation
Uptrace has no AI SRE, no MCP server, and no native integration with AI coding tools. Alerting goes to email, Slack, webhook, or AlertManager. The investigation from that point is entirely manual. Uptrace's positioning is explicitly focused on lean, cost-efficient APM rather than AI-augmented operations.
This is not a criticism of Uptrace's design. The tool is honest about its scope. But if your evaluation of Datadog alternatives includes "does this tool have AI investigation?" the answer from Uptrace is no, and that is unlikely to change soon given the team size and product focus.
| AI capability | Datadog | Uptrace |
|---|---|---|
| Autonomous investigation (fires on alert) | Yes (Bits AI SRE, GA Dec 2025) | No |
| MCP server | Yes (Preview) | No |
| AI coding tool integration | Claude, Cursor via MCP | No |
| Natural language observability queries | Yes (Bits Chat) | No |
| AI for security | Yes (Bits Security Analyst) | No |
[summary]
### AI that also wakes someone up
Datadog has autonomous AI investigation and Uptrace has neither. What neither one includes is a direct path from a root cause hypothesis to an on-call notification, an incident timeline, and a customer-facing status page update. Better Stack's AI SRE connects to the full incident lifecycle so the investigation and the response happen in the same place.
**Autonomous root cause investigation connected to on-call, incidents, and status pages.** [See the AI SRE.](https://betterstack.com)
[/summary]
---
## Digital experience and error tracking
Datadog has a full digital experience suite including session replay, RUM for web and mobile, synthetic monitoring, and product analytics. Uptrace has none of this.
### Datadog: full digital experience suite

Browser RUM, Mobile RUM across iOS, Android, React Native, and Flutter, Session Replay, Synthetic Monitoring, Product Analytics, and Experiments. The frontend-to-backend correlation is seamless because RUM and APM share the same backend. Each component is a separate line item on the invoice.
### Uptrace: error tracking via trace spans, no frontend monitoring

Uptrace surfaces exceptions and errors through its tracing interface. Spans that contain exceptions are grouped and surfaced with error rates tracked as part of RED metrics on your service map. This covers backend error visibility well for engineering debugging workflows.
What Uptrace does not have: a standalone error tracking product with issue assignment workflows, session replay, any frontend monitoring, synthetic monitoring, or AI-assisted debugging prompts. Teams that need those capabilities use Uptrace for backend observability and add Sentry or a similar tool for error tracking and frontend monitoring.
| Digital experience | Datadog | Uptrace |
|---|---|---|
| Browser RUM | Yes | No |
| Mobile RUM | Yes (iOS, Android, React Native, Flutter) | No |
| Session replay | Yes | No |
| Synthetic monitoring | Yes | No |
| Error tracking (standalone) | Yes | No (within traces only) |
| Frontend-to-backend correlation | Seamless | Not available |
---
## Incident management and alerting
Datadog is closer to a complete product here. Uptrace covers alerting and stops there.
### Datadog: seat-based incident management with On-Call
Datadog's alerting covers metrics thresholds, log patterns, trace error rates, and uptime checks. Incident management, on-call scheduling via Datadog On-Call or external tools, and phone/SMS delivery are all available. Bits AI SRE activates automatically when incidents trigger.
### Uptrace: alerting only, no incident management
Uptrace sends alerts via email, Slack, webhook, and AlertManager when thresholds are breached. You get the notification. Paging the right person, managing on-call rotations, tracking the incident, and generating a post-mortem all happen outside Uptrace. For five on-call engineers on PagerDuty Professional, that adds $245 to $415 per month on top of your Uptrace bill.
The alerting quality within Uptrace's scope is solid: rules can fire on metric thresholds, log patterns, or trace anomalies, and multiple notification channels are supported. The gap is everything that happens after the notification lands.
| Incident management | Datadog | Uptrace |
|---|---|---|
| On-call scheduling | Via Datadog On-Call or external | Not available |
| Phone/SMS delivery | Via Datadog On-Call or external | Not available |
| Escalation policies | Via Datadog On-Call or external | Not available |
| Post-mortems | Yes (seat-based product) | Not available |
| Status pages | No | No |
| Monthly cost (5 responders) | Via Datadog On-Call or PagerDuty | PagerDuty (~$245-415/month) |
[summary]
### Enterprise observability without the multi-vendor model
Both Datadog and Uptrace require separate tools for on-call scheduling. Better Stack consolidates logs, metrics, traces, on-call scheduling, incident management, and status pages into one platform with one bill.
**Fewer vendors, fewer context switches, and a single place for the full reliability workflow.** [Talk to us.](https://betterstack.com)
[/summary]
---
## Deployment and integration
Uptrace's deployment flexibility is one of its clearest structural advantages over Datadog.
### Datadog: SaaS only, fast agent-based deployment
The Datadog Agent installs on every host and begins sending data within minutes. No self-hosted option. All your telemetry lives in Datadog's infrastructure permanently. For organizations with air-gapped environments, strict data residency requirements, or compliance policies that prohibit shipping data to a third-party SaaS, Datadog is not viable regardless of the feature comparison.
### Uptrace: multiple deployment paths, full data ownership on self-hosted
Uptrace Cloud runs in Hetzner's Germany data centers with Finnish backups. All data stays in the EU, which is GDPR-friendly by design. The Community Edition on GitHub is free and fully featured. Managed on-premises installations are available from $1,000/month (excluding hosting), including Terraform and Ansible automation, custom retention policies, a dedicated support engineer, and SOC 2 certification on request.
The OTel Collector is the recommended ingestion path for production environments, handling batching, retry logic, and routing before data reaches Uptrace. The v2.0 real-time transformation layer lets you filter, enrich, or sample at the ingestion layer before data reaches storage.
The Grafana datasource compatibility is worth mentioning for teams with existing Grafana investments. If you have years of Grafana dashboards built on Prometheus data, you can point those dashboards at Uptrace as a Prometheus datasource without rebuilding anything.
| Deployment | Datadog | Uptrace |
|---|---|---|
| Time to first data | Minutes | Hours (if OTel already deployed) |
| Self-hosted | No | Yes (free Community Edition) |
| Air-gapped | No | Yes |
| On-premises managed | No | Yes (from $1,000/month) |
| EU data residency | Limited | Yes (Germany + Finland, by design) |
| Grafana compatibility | Limited | Yes (Tempo + Prometheus datasource) |
| Hard budget cap | No | Yes |
---
## What each platform genuinely lacks
**Datadog gaps worth knowing:**
- No free tier; evaluation requires a paid trial
- No self-hosted option; all telemetry lives in Datadog's infrastructure permanently
- High-water mark billing can move your invoice unexpectedly from traffic spikes
- OpenTelemetry metrics charged as custom metrics with surcharges
- No status pages
- No hard budget cap; adversarial traffic events can produce unexpected bills
- Costs compound aggressively with every product added
**Uptrace gaps worth knowing:**
- No eBPF-based trace capture; all services need OTel SDK instrumentation
- No AI SRE, no MCP server, no integration with AI coding tools
- No RUM, no session replay, no synthetic monitoring, no frontend monitoring
- No standalone error tracking with issue assignment workflows
- No incident management, no on-call scheduling, no phone/SMS delivery
- No status pages
- No HIPAA compliance
- No FedRAMP authorization
- Third-party review coverage is sparse; financial stability not publicly verifiable
- Team is small (EU-based), which affects support coverage and development pace
---
## Final thoughts
The choice between Datadog and Uptrace comes down to one question: how much of your observability stack do you need in one place, and how much are you willing to pay for that consolidation?
**Uptrace is the right choice when low cost, OpenTelemetry-native observability, and deployment flexibility matter more than having every capability in a single platform.** Your team can already be fully instrumented with OTel SDKs, manage on-call and incident response through separate tools, and skip capabilities such as RUM, session replay, or AI investigation. Whether you want to self-host everything for free or use EU-only cloud hosting with a predictable budget, Uptrace is genuinely difficult to beat. The Community Edition is free, fully functional, and backed by an active development team, while Uptrace Cloud starts cheaper than almost any other managed observability service.
**Datadog justifies its premium when you need an integrated platform that extends well beyond APM.** The seamless investigation workflow, session replay, RUM, Bits AI SRE, MCP server, Cloud SIEM, workload protection, and enterprise compliance features are all designed to work together in a single system. Those capabilities come at a significantly higher cost, and the bill grows as you adopt more products, but for organizations that rely on them, the gap between Datadog and Uptrace is substantial.
**There is also a practical middle ground that many engineering teams choose.** Pairing Uptrace with tools such as PagerDuty for on-call, Sentry for error tracking, and a status page service can deliver a capable observability stack at a fraction of Datadog's cost. Whether that approach makes sense depends on your telemetry volumes and whether the savings outweigh the operational overhead of managing multiple vendors.
[summary]
### One thing neither covers: the full reliability layer
Neither Datadog nor Uptrace includes uptime monitoring, unlimited phone/SMS on-call alerting, incident management, and customer-facing status pages in a unified product. Better Stack brings all of that together with logs, metrics, and traces, with usage-based pricing and no per-host fees.
**The full reliability lifecycle in one place. Start free, no credit card required.** [Try Better Stack.](https://betterstack.com)
[/summary]
---