# Datadog vs IBM Instana: A Complete Comparison for 2026
Datadog and IBM Instana sit in the same enterprise observability category, but they take different approaches to solving the problem. Datadog has expanded into a broad platform that combines observability, security, digital experience monitoring, and AI-powered workflows. Instana has focused more heavily on automated application monitoring, deep tracing, and support for complex enterprise environments.
**If you want a single platform for observability, security, digital experience monitoring, and AI-powered operations, Datadog offers a broader feature set.** Its capabilities extend beyond traditional monitoring to include Cloud SIEM, network performance monitoring, synthetic testing, and AI integrations.
**If trace fidelity, self-hosting, or support for mainframes and other legacy infrastructure are non-negotiable requirements, Instana has clear advantages.** It provides 100% unsampled tracing, IBM Z and mainframe monitoring, FedRAMP authorization, and self-hosted deployments with feature parity to its SaaS offering.
The pricing models reflect those differences. Datadog charges separately for many products and data types, which can increase costs as adoption expands. Instana bundles more functionality into its MVS-based licensing model, making spending easier to predict even though costs still scale with infrastructure size. Neither platform is inexpensive, so understanding the tradeoffs matters far more than comparing headline prices alone.
## Quick comparison at a glance
| Feature | Datadog | IBM Instana |
|---|---|---|
| **Deployment model** | SaaS only | SaaS, self-hosted (full feature parity), pay-per-use |
| **Free tier** | No | No (14-day free trial) |
| **Starting price** | $15/host/month (infra only) | $21.20/MVS/month (Essentials) |
| **Full APM price** | $31–$40/host/month (on top of infra) | $79.50/MVS/month (Standard, all-inclusive) |
| **Pricing model** | Per-host + per-GB + per-feature | Per MVS (all features bundled) |
| **Minimum commitment** | None | 10 MVS licenses |
| **Custom metric surcharges** | Yes ($1/100 beyond allotment) | No |
| **Trace sampling** | Configurable (sampling applies) | 100% unsampled by default |
| **Metrics granularity** | Sub-second | 1-second |
| **OTel-native** | Partial (prefers DD Agent) | Yes (alongside proprietary sensors) |
| **APM / distributed tracing** | Yes | Yes (100% capture) |
| **Log management** | Yes (two-tier billing) | Yes (add-on, separate pricing) |
| **Infrastructure monitoring** | Yes | Yes |
| **Cloud monitoring (AWS/Azure/GCP)** | Yes | Yes (300+ technology sensors) |
| **Kubernetes monitoring** | Yes | Yes |
| **Real user monitoring** | Yes (browser + mobile) | Yes (browser + mobile) |
| **Session replay** | Yes | Yes |
| **Synthetic monitoring** | Yes | Yes (via Managed PoPs add-on) |
| **Incident management** | Yes (seat-based add-on) | Via integrations (PagerDuty, ServiceNow) |
| **Status pages** | No | No |
| **On-call scheduling** | Via Datadog On-Call or external | Not included |
| **AI SRE / autonomous investigation** | Yes (Bits AI SRE, GA Dec 2025) | Yes (Agentic AI, in Preview) |
| **Auditable AI reasoning trail** | No | Yes |
| **MCP server** | Yes (Preview) | No |
| **Cloud SIEM / security** | Yes (extensive) | No |
| **Network monitoring** | Yes | Limited |
| **Mainframe / IBM Z** | No | Yes |
| **SOC 2 Type II** | Yes | Yes |
| **FedRAMP** | Yes (GovCloud) | Yes |
| **HIPAA** | Yes | Yes |
| **Self-hosted** | No | Yes (full feature parity, $120/MVS) |
---
## Platform architecture and philosophy
These two platforms took the same early bet that automatic instrumentation should not require developers to rewrite their services. They arrived at that goal through different mechanisms, and those mechanisms produce meaningfully different architectural outcomes.
### Datadog: proprietary SaaS with tight cross-signal integration

Datadog is built on a proprietary agent and a proprietary data model. You install the Datadog Agent on every host, it collects metrics, logs, and traces, and ships them to Datadog's hosted infrastructure. The integration is tight by design: a Kubernetes pod, a database query, a browser session, a CI pipeline run, and a security alert all land in one system and can be correlated through shared context. That seamless cross-signal navigation is genuinely one of Datadog's strongest capabilities.
The tradeoff is lock-in. Your data lives in Datadog's systems in Datadog's format. Your dashboards are built in Datadog's query language. If you use OpenTelemetry, Datadog treats those metrics as custom metrics with additional charges. If you decide to leave, you are looking at re-instrumenting your entire stack.
### IBM Instana: agent-based auto-discovery with Dynamic Graph and 100% trace capture

Instana's approach is agent-based: a single agent binary deploys to each host and automatically installs technology-specific sensors when it detects a supported runtime or database. You install the agent once, and it discovers Java, Node.js, Python, Go, .NET, PHP, and 300+ other technologies without per-service configuration. This gives Instana something Datadog approaches differently: code-level visibility into function call stacks through per-process sensors.
The Dynamic Graph is Instana's real architectural differentiator. It models every application component and its relationships in real time, updating continuously as services start, stop, and change. When an incident fires, Instana already has a live map of which components are connected, which upstream changes occurred, and which downstream services are affected. The correlation is structural, not just temporal.
**100% unsampled tracing** is Instana's most distinctive technical claim. While most APM tools apply sampling to control storage costs, Instana captures every single request at 1-second granularity. For teams in financial services or healthcare where audit requirements demand complete trace records, this matters significantly.
The tradeoff is scope. Instana is APM-first. Log management is available but is a separately priced add-on. Incident management is handled via integrations with PagerDuty, Slack, ServiceNow, and OpsGenie rather than built in. Status pages do not exist. Error tracking is not a standalone product. If APM is your primary need and you accept routing other workflow components to third-party tools, Instana's architecture is well-matched. If you want everything in one place, you will be assembling a multi-vendor stack.
| Architectural factor | Datadog | IBM Instana |
|---|---|---|
| Instrumentation | Proprietary agent + SDK per service | Agent + technology sensors (auto-deploy) |
| Trace sampling | Configurable (sampling applies) | 100% unsampled by default |
| Metrics granularity | Sub-second | 1-second |
| Data model | Proprietary (hosted) | Dynamic Graph (proprietary, self-hostable) |
| Query language | Proprietary (DQL) + some PromQL | Tag-based filter UI + API |
| Log management | Core product | Add-on (separate pricing) |
| Self-hosted option | No | Yes (full feature parity) |
| Mainframe support | No | Yes (IBM Z / z/OS) |
| Code-level profiling | Yes (Continuous Profiler) | Yes (per-process via sensors) |
| Vendor lock-in risk | High (proprietary format + agent) | Medium (self-hostable, OTel supported) |
[summary]
### Neither Datadog nor IBM Instana covers the full reliability picture
Both platforms focus on telemetry and APM. Neither includes built-in on-call scheduling with phone and SMS delivery or customer-facing status pages as part of the core product. Better Stack brings all of that together in one place alongside logs, metrics, and traces, so you can go from alert to post-mortem without switching tools.
**From heartbeat monitoring to incident timelines to status pages, one platform for the whole reliability lifecycle.** [Start free.](https://betterstack.com)
[/summary]
---
## APM and distributed tracing
APM is where Instana is strongest and where the comparison is most competitive. Both platforms auto-discover services and trace requests without requiring developers to instrument every service manually. The differences are in completeness, depth, and pricing.
### Datadog: agent-based APM with Continuous Profiler and per-host billing
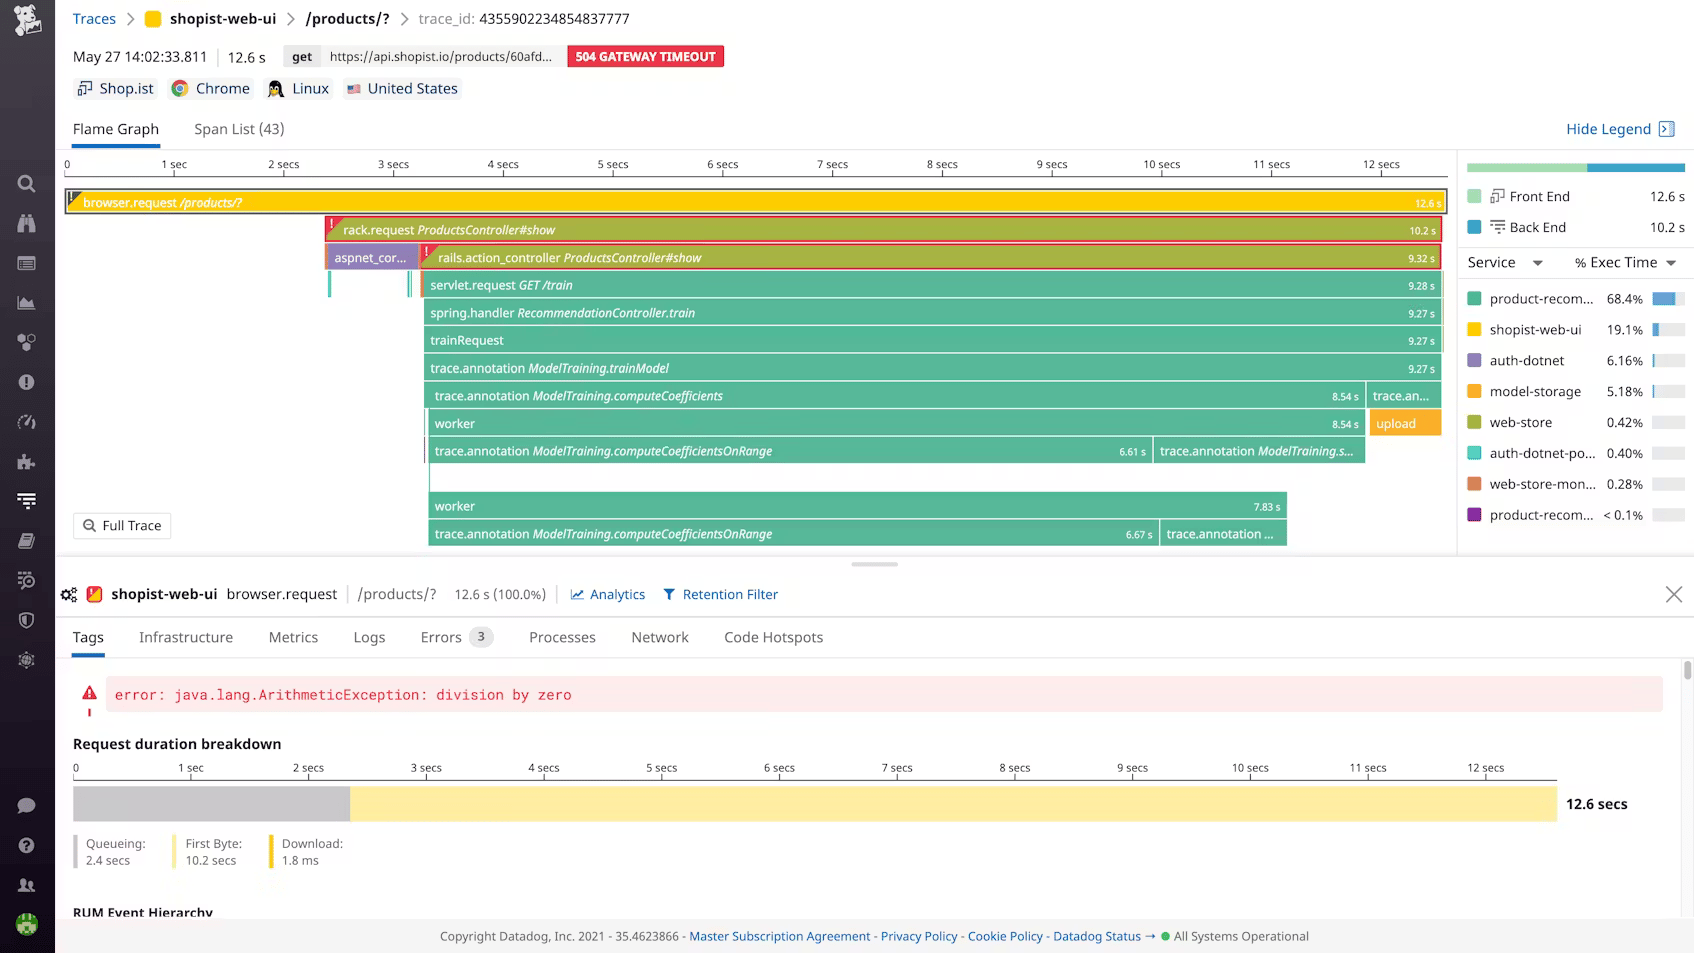
Datadog APM requires installing language-specific tracing libraries in each service: `ddtrace` for Python, `dd-trace-go` for Go, `dd-trace-java` for Java. Each service gets its own SDK installation, environment variable configuration, and sampling rate tuning to control span indexing costs. The upside is depth: service maps, Continuous Profiler for code-level CPU attribution, Dynamic Instrumentation for adding log lines to production without redeploying, and Watchdog for automatic anomaly detection.
The cost structure matters. APM is billed at $31 to $40 per host per month, on top of the infrastructure fee, with 150 GB of ingested spans and 1 million indexed spans included per host per month. High-throughput microservices routinely exceed those limits. And if you use OpenTelemetry instrumentation, Datadog charges those metrics as custom metrics, penalizing you for following the open standard.
### IBM Instana: 100% unsampled tracing with Dynamic Graph and code-level sensors

Instana traces transactions across all components of an application, providing insights into individual component performance and how they interact, with detailed context for troubleshooting. Unlike competitors that sample traces, Instana captures 100% of all requests in real time, ensuring complete visibility into application performance. For teams in financial services or healthcare where audit requirements demand complete trace records, or for debugging intermittent issues that only appear in a fraction of requests, this matters.
The Dynamic Graph builds a continuously updated model of all service relationships. When something breaks, Instana already knows which components depend on which others and shows you the propagation path. Code-level profiling is available through Instana's language sensors, showing which functions are consuming CPU and where memory allocations occur, deeper than what agent-level sampling can typically surface.
OpenTelemetry is fully supported alongside Instana's native sensors. The full-stack Standard plan includes APM, distributed tracing, infrastructure monitoring, digital experience monitoring, and synthetic monitoring, all bundled into the $79.50/MVS/month rate. There are no separate APM charges stacked on top of infrastructure fees.
Is the 100% unsampled tracing guarantee worth the per-host premium compared to Datadog? For compliance-driven teams and teams debugging subtle concurrency issues that only surface in rare traces, yes. For teams whose workloads are well-represented by 1-to-10% sampling, the guarantee has less practical value.
| APM / tracing | Datadog | IBM Instana |
|---|---|---|
| Instrumentation | Proprietary SDK per service | Agent sensors (auto-deploy, 300+ technologies) |
| Trace completeness | Configurable sampling | 100% unsampled by default |
| Code-level profiling | Yes (Continuous Profiler) | Yes (per-process via sensors) |
| Dynamic instrumentation | Yes | No |
| Dependency mapping | Service maps | Dynamic Graph (real-time, structural) |
| OTel support | Yes (custom metric surcharge applies) | Yes (alongside native sensors, no surcharge) |
| Mainframe tracing | No | Yes (IBM Z / z/OS end-to-end) |
| APM pricing | $31–$40/host/month (on top of infra) | Included in Standard MVS ($79.50/host/month) |
[summary]
### APM without the per-host bill
Both Datadog and IBM Instana charge per host for APM. Better Stack's tracing is priced by data volume with no span indexing fees, no per-host charges, and no cardinality penalties, and the AI SRE activates automatically during incidents to investigate root cause before you have to ask.
**Full-fidelity distributed tracing from every service, priced by volume with no surprises.** [Explore Better Stack tracing.](https://betterstack.com/tracing)
[/summary]
---
## Log management
Log management is where the gap between these two platforms shows up most clearly. For Datadog, logs are a core product with their own billing dimensions. For Instana, logs are a separately priced add-on to what is fundamentally an APM platform.
### Datadog: two-tier billing where indexing is the hidden cost
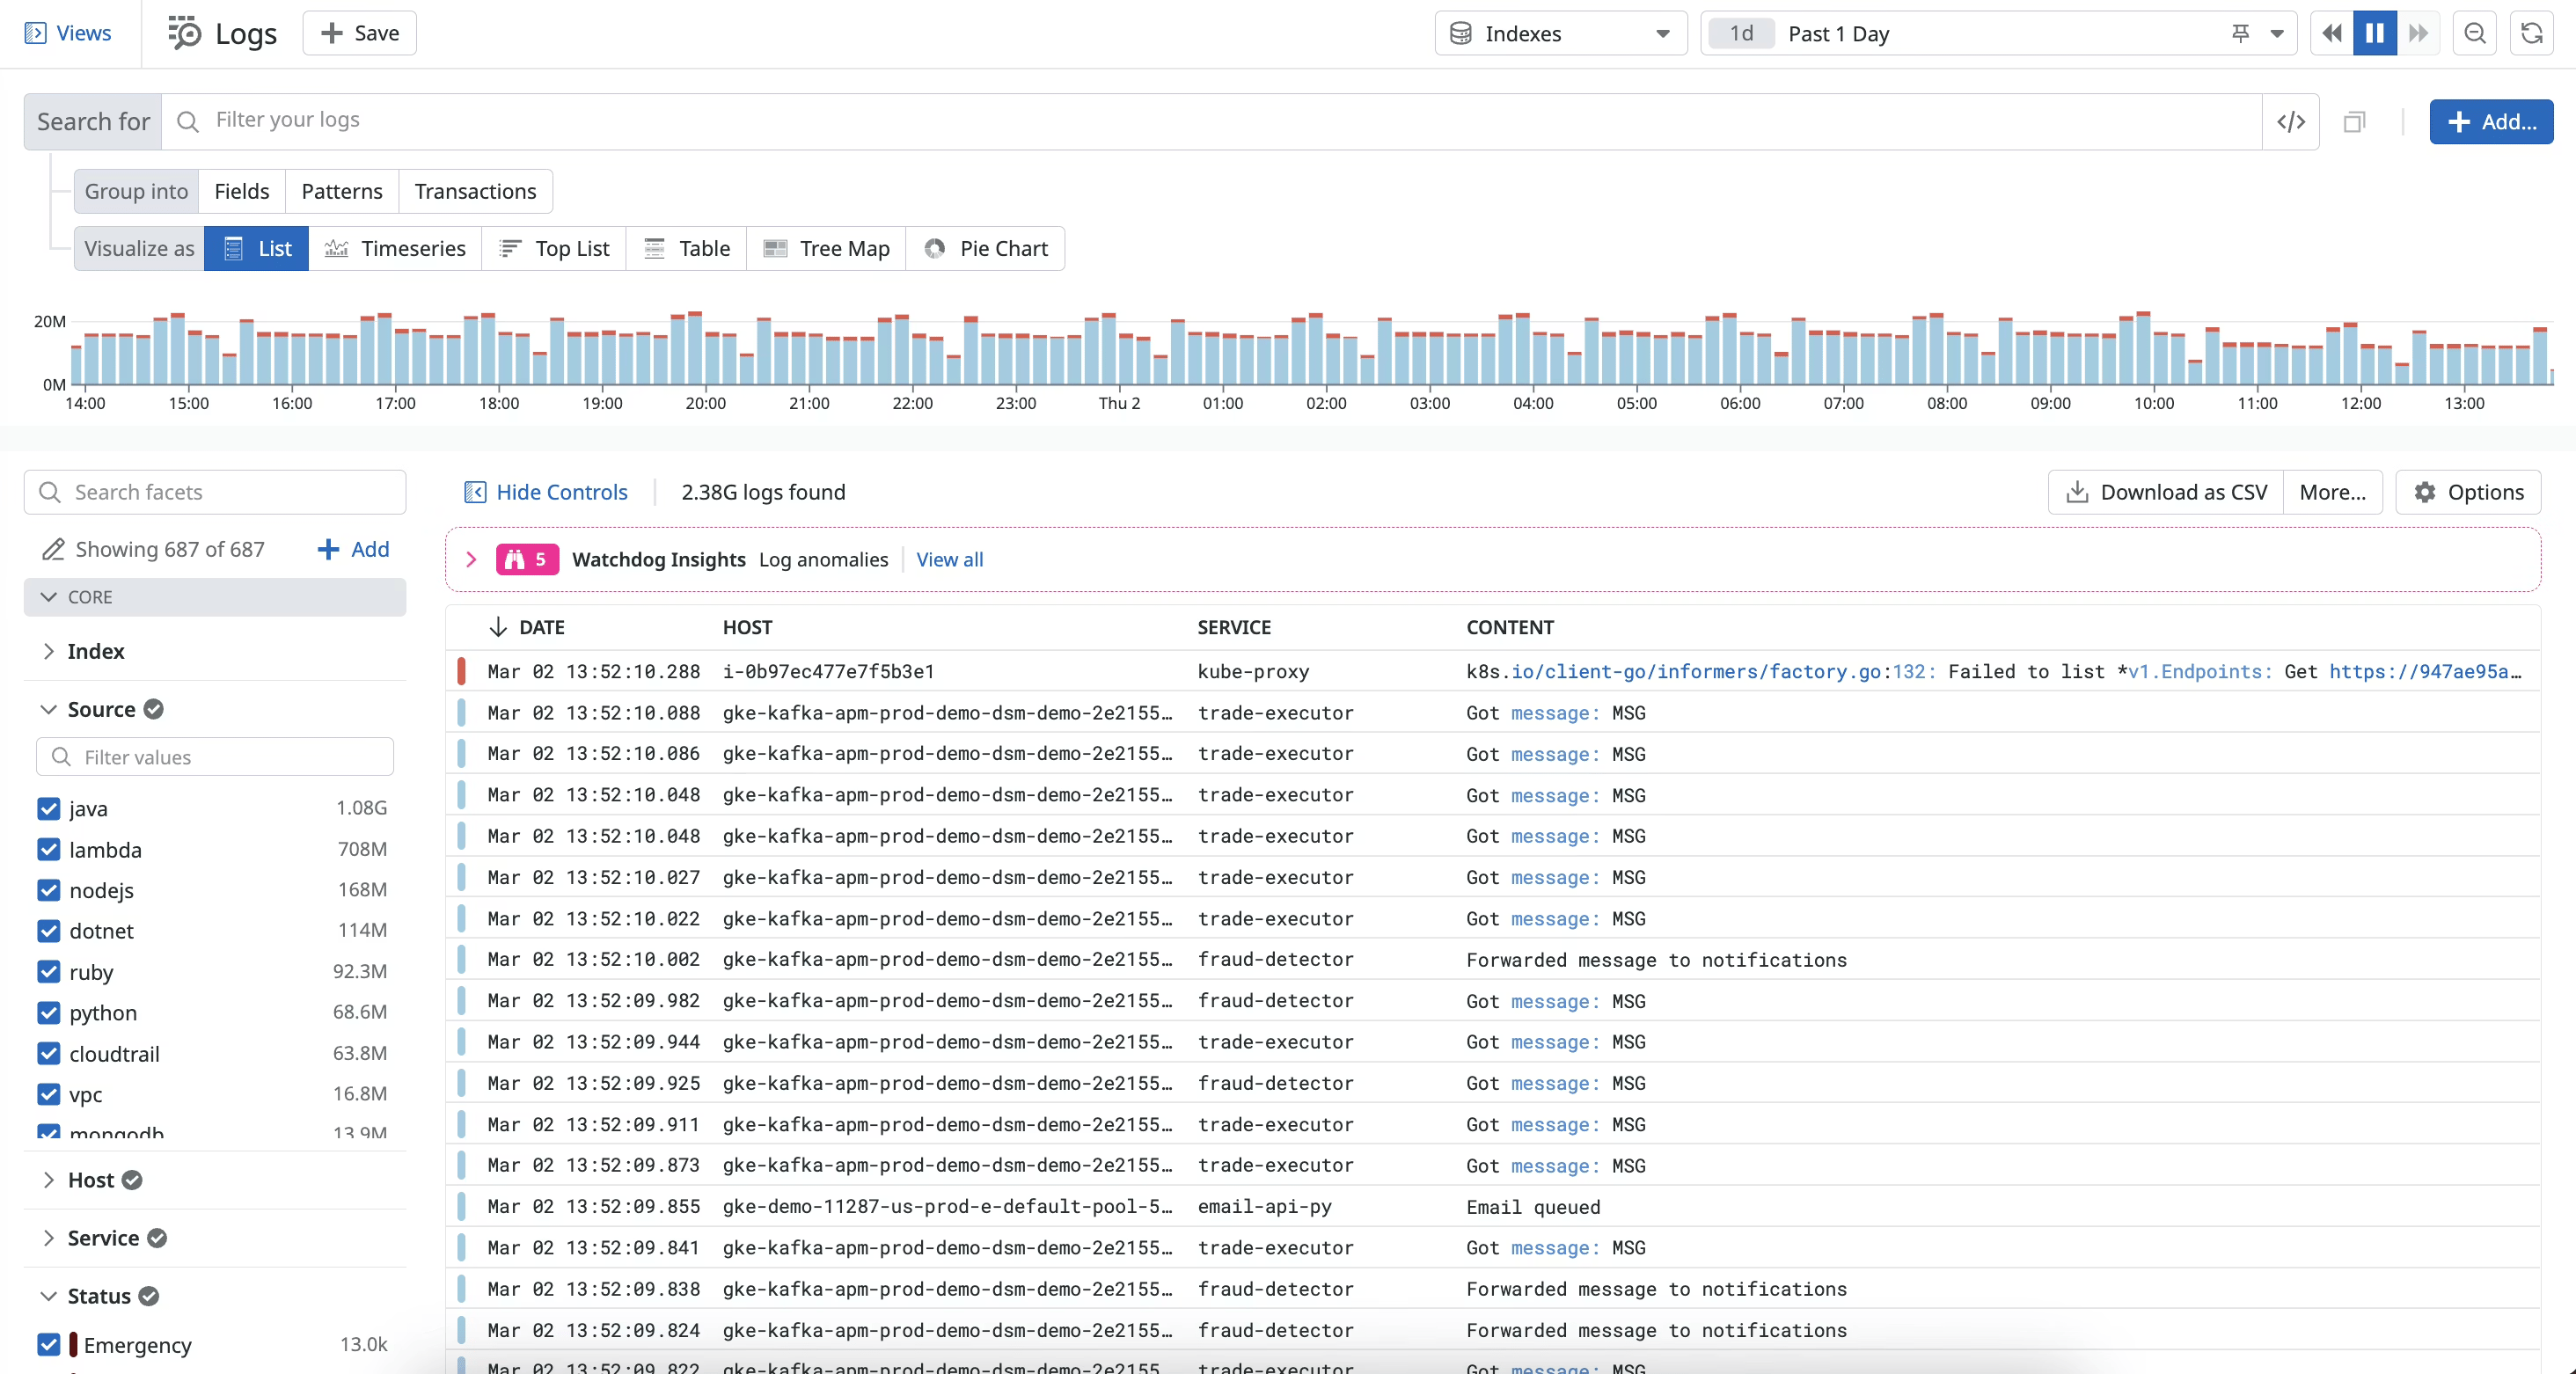
Datadog log management uses a two-tier billing model. You pay $0.10/GB for ingestion, whether you search logs or not. Then you pay $1.70 per million log events to index them, which is what makes them actually searchable. Most teams ingest everything and index selectively to control costs. The query experience is strong: faceted search, Log Patterns clustering, Sensitive Data Scanner for PII redaction, and seamless correlation to traces and host metrics.
The honest limitation is cost at scale. If you are running 100 GB of log volume per day, the Datadog log bill alone approaches $107,000 per year before APM, RUM, or anything else.
### IBM Instana: logs as a paid add-on with flexible retention

IBM Instana includes log ingestion from any source with flexible retention options of 30, 60, or 90 days. Log management is priced separately from the MVS license at roughly $0.35/GB ingested, which means your Instana contract covers APM, infrastructure, and RUM, but logs require additional negotiation and budget. G2 reviewers specifically note that log collection requires more manual pipeline configuration compared to the zero-touch experience Instana markets for its APM sensors.
The log-to-trace correlation works when the correlation context is present, but the log data may not be available if retention windows have passed or if the log pipeline configuration is incomplete. Instana's log experience is secondary to its APM experience in a way that Datadog's is not.
For teams where log management is a primary use case rather than a complement to APM, Datadog is the more complete product. For teams whose primary need is deep APM with logs as a supporting signal, Instana's add-on model may be acceptable.
| Log management | Datadog | IBM Instana |
|---|---|---|
| Product status | Core product | Add-on (separate pricing) |
| Effective cost | ~$2.50–$3.00/GB (ingestion + indexing) | ~$0.35/GB (separate from MVS) |
| Searchability | 10–20% typically (indexed) | Yes, within retention window |
| Retention | 15 days (indexed) default | 30, 60, or 90 days |
| Trace correlation | Seamless (single backend) | Yes (requires configuration) |
| Query language | Proprietary Log Search | Filter-based UI |
[summary]
### Log search with no indexing tax
Both Datadog and IBM Instana have pricing structures that can produce surprises at scale. Better Stack stores logs in a unified warehouse with SQL querying, no separate indexing layer, and no per-event charges. You pay for what you send, and all of it is searchable.
**Unified log management with SQL search, live tail, and no indexing surprises.** [See how it works.](https://betterstack.com/logs)
[/summary]
---
## Infrastructure monitoring and cloud metrics
Both platforms auto-discover infrastructure and provide cloud-native monitoring. The pricing model is where they differ most sharply for infrastructure coverage.
### Datadog: comprehensive fleet visibility on a stacking per-host model

Datadog infrastructure monitoring is billed at $15/host/month on Pro (annual) or $23/host/month on Enterprise. Host maps visualize your fleet. Kubernetes monitoring covers cluster state, node health, pod metrics, and autoscaling events. Network Performance Monitoring tracks traffic between services and through load balancers. Cloud Cost Management ties spending to infrastructure metrics.
The high-water mark billing model is the key risk: Datadog meters host count hourly, drops the top 1%, and bills the month at the 99th-percentile peak. A five-day traffic spike can set your bill for the entire month at peak count.
### IBM Instana: real-time infrastructure with Dynamic Graph correlation and mainframe reach

IBM Instana delivers real-time infrastructure monitoring through its Dynamic Graph, which automatically maps all infrastructure components and their relationships. Each block within the pillar view represents software components running on a host, with color changes indicating degradation. The visual model makes it immediately obvious which hosts have degraded components and where in the stack the problem originates. Infrastructure monitoring is included in the MVS license at no additional per-feature cost.
Where Instana uniquely extends beyond Datadog is mainframe and IBM Z monitoring. For organizations running z/OS workloads alongside modern Kubernetes deployments, Instana surfaces both in the same interface, correlating mainframe performance data with microservice traces. Datadog has no equivalent capability.
Standard AWS, Azure, and GCP cloud monitoring is covered through Instana's sensor library, which integrates with 300+ technologies out of the box. The billing scales linearly with your host count rather than with your data volume, which means large fleets with modest per-host data volumes benefit from the predictability, while heavy data generators may prefer volume-based pricing.
| Infrastructure monitoring | Datadog | IBM Instana |
|---|---|---|
| Base pricing | Per-host ($15–$23/month) | Per-MVS (included in Standard $79.50/month) |
| High-water mark billing | Yes (peak-of-99% monthly) | No (average monthly host count) |
| Kubernetes monitoring | Yes | Yes |
| Network performance monitoring | Yes | Limited |
| Mainframe / IBM Z | No | Yes |
| Technology sensor library | 750+ integrations | 300+ technology sensors |
| Cloud cost management | Yes | No |
| Visual health model | Service maps, dashboards | Dynamic Graph with color-coded pillars |
[summary]
### Infrastructure metrics connected to the full reliability workflow
Both Datadog and IBM Instana charge for infrastructure telemetry in ways that scale with your fleet. Better Stack takes a different approach: no per-host fees, no cardinality penalties, and infra metrics that live alongside uptime monitors, on-call schedules, and incident timelines.
**Infrastructure monitoring connected to alerting, on-call, and incident management, all in one place.** [Get started free.](https://betterstack.com)
[/summary]
---
## Digital experience monitoring
Both platforms offer mature digital experience suites. The difference is more about pricing model and ecosystem integration than feature completeness.
### Datadog: full digital experience suite with seamless backend correlation

Datadog's Digital Experience suite covers Browser RUM, Mobile RUM (iOS, Android, React Native, Flutter), Session Replay, Synthetic Monitoring, Product Analytics, and Experiments. The frontend-to-backend correlation is seamless because RUM and APM share the same backend. The full suite requires purchasing RUM, Session Replay, and Synthetic Monitoring as separate line items.
### IBM Instana: DEM bundled in Standard with mobile and synthetic included

IBM Instana's digital experience monitoring combines RUM and synthetic monitoring in the Standard plan. Browser and mobile app monitoring (iOS and Android) are included, tracking real user page loads, errors, and performance by browser, geography, and device. Session replay is available. Synthetic monitoring executes scripted tests from multiple global locations to continuously monitor key user journeys, though synthetic testing from Managed PoPs is an add-on priced at $0.00031 per execution.
Instana's G2 Winter 2026 awards include DEM Overall, Mid-market, SMB, and Momentum Leader recognition, which reflects genuine customer satisfaction with its digital experience capabilities.
The key distinction from Datadog: Instana bundles most of the DEM suite into the Standard MVS rate rather than charging per-session or per-test. This makes DEM cost more predictable for Instana customers, while Datadog's RUM and Synthetic costs scale independently with session and test volumes.
| Digital experience | Datadog | IBM Instana |
|---|---|---|
| Browser RUM | Yes | Yes |
| Mobile RUM | Yes (iOS, Android, React Native, Flutter) | Yes (iOS, Android) |
| Session replay | Yes | Yes |
| Synthetic monitoring | Yes (global probe network) | Yes (Managed PoPs add-on) |
| Core Web Vitals | Yes | Yes |
| Frontend-to-backend correlation | Seamless (single backend) | Built-in via Dynamic Graph |
| Pricing | Per session + per test (separate SKUs) | Included in Standard MVS |
---
## AI capabilities
Both platforms shipped meaningful AI in 2025 and 2026. The approaches differ in autonomy, auditability, and what external AI clients can access.
### Datadog Bits AI: autonomous investigation that fires at alert time

Datadog launched Bits AI SRE in December 2025 as its first generally available autonomous AI agent. When an alert fires, Bits AI SRE starts investigating without waiting for anyone to prompt it. By the time you reach your laptop, it has typically identified a likely root cause. Beyond Bits AI SRE, Datadog has Bits Chat, Bits Code, Bits Agent Builder, Bits Security Analyst, and an MCP Server (currently in Preview) for connecting Claude, Cursor, and other AI clients to Datadog data. The MCP server is a meaningful differentiator: your AI coding assistant can query logs, check on-call schedules, acknowledge incidents, and build dashboards through natural language without leaving the development environment.
### IBM Instana: agentic AI investigation with full auditable reasoning trail

IBM Instana's agentic AI investigation capability (currently in Preview for root cause analysis) launches a full investigation into an incident with a single click. Instana then uses agentic AI to create a step-by-step runbook of actions to remediate the incident and can generate a Bash script for each remediation step, saving development time.
What Instana does that Datadog does not: it automatically documents every step of the AI agent's investigation, including the hypotheses tested, evidence collected, components inspected, and the reasoning behind each conclusion. This produces a clear, auditable narrative for post-mortems, compliance needs, and cross-team handoffs. For regulated environments where AI-driven decisions must be documented and reviewable, this capability has real practical value that Datadog's Bits AI SRE does not match today.
Instana also automatically discovers and maps GenAI workflows and agents, connecting prompts, outputs, tokens, latency, cost, and errors to full-stack context for troubleshooting AI-driven services. The GenAI observability is mature for teams running LLM-based applications in production.
Instana does not currently have an MCP server. Its AI capabilities live inside the Instana interface, not in a protocol that Claude, Cursor, or Windsurf can access directly.
| AI capability | Datadog | IBM Instana |
|---|---|---|
| Autonomous investigation (no prompting) | Yes (Bits AI SRE, GA Dec 2025) | Yes (Agentic AI, in Preview) |
| Auditable AI reasoning trail | No | Yes (full documented investigation) |
| Remediation scripts | No | Yes (Bash, step-by-step runbook) |
| MCP server | Yes (Preview) | No |
| GenAI / LLM observability | Yes (Agent Observability) | Yes (tokens, prompts, costs, routing) |
| External AI client access | Claude, Cursor, etc. via MCP | Not supported |
| Security AI analyst | Yes (Bits Security Analyst) | No |
[summary]
### AI that also wakes someone up
Both Datadog and IBM Instana have AI investigation features. What neither one includes is a direct path from an AI-generated root cause hypothesis to an on-call notification, an incident timeline, and a customer-facing status page update. Better Stack's AI SRE connects to the full incident lifecycle so the investigation and the response happen in the same place.
**Autonomous root cause investigation connected to on-call, incidents, and status pages.** [See the AI SRE.](https://betterstack.com)
[/summary]
---
## Incident management and alerting
This is a category where both platforms lean on third-party tools, though the depth of their native capabilities differs.
### Datadog: seat-based incident management with Bits AI acceleration
Datadog's incident management is a seat-based SKU. You declare incidents from monitor alerts, security signals, or events, and the platform provides incident tracking, responder assignment, timeline management, and Slack/Teams integration. On-call scheduling is available through Datadog On-Call (launched late 2024) or through integrations with PagerDuty and OpsGenie. Phone and SMS alert delivery requires those external tools.
### IBM Instana: SmartAlerts with third-party on-call routing

Instana provides SmartAlerts powered by AI and machine learning that learn normal behavior and reduce alert fatigue by correlating related events into single actionable notifications using Dynamic Graph context. Each alert already includes knowledge of which other components are affected and what the upstream propagation path looks like.
What Instana does not include is the delivery layer: on-call rotations, phone/SMS escalation, escalation policies, or post-mortem generation. Those are handled via integrations with PagerDuty ($49 to $83/user/month), OpsGenie, or ServiceNow. For 5 responders on PagerDuty, that adds $245 to $415/month on top of the Instana contract.
Datadog is modestly ahead here in terms of native capability through Datadog On-Call, though both platforms fundamentally route serious incident response work to external tools.
| Incident management | Datadog | IBM Instana |
|---|---|---|
| Alert intelligence | Threshold + anomaly detection + Bits AI | SmartAlerts (ML, Dynamic Graph correlated) |
| Native incident management | Yes (seat-based SKU) | No (integrations only) |
| Phone/SMS delivery | Via Datadog On-Call or PagerDuty | Via PagerDuty/OpsGenie |
| On-call scheduling | Via Datadog On-Call or external | Not included |
| Post-mortems | Yes | Via ServiceNow or manual |
| Status pages | No | No |
---
## Pricing comparison
The pricing comparison requires understanding what is and is not included in each platform's base rate, because the headline numbers are structured very differently.
### Datadog: multidimensional billing that compounds as you add products

Datadog bills across several independent dimensions: per-host for infrastructure ($15 to $23/month) and APM ($31 to $40/month), per-GB for log ingestion ($0.10), per million events for log indexing ($1.70), and per metric for custom metrics beyond the per-host allotment. The high-water mark billing model means a five-day traffic spike sets your bill for the whole month at peak host count. Adding products like RUM, database monitoring, network monitoring, and security compounds the base charges.

For a 100-host deployment with APM, logs, and RUM, Datadog commonly runs $20,000 to $30,000 per month.
### IBM Instana: per-MVS bundled pricing with predictable scaling
IBM Instana Standard SaaS is $79.50/MVS/month, with a minimum order of 10 MVS licenses. The Standard plan bundles APM, infrastructure monitoring, digital experience monitoring (RUM + synthetic), AI-powered alerting, and CI/CD pipeline feedback into the per-host rate. Log management is a separately priced add-on at roughly $0.35/GB. Self-hosted deployment is available at $120/MVS/month.
**Scenario: 100 hosts, moderate data volume**
| Cost component | Datadog (Pro, annual) | IBM Instana Standard SaaS |
|---|---|---|
| Infrastructure monitoring | $1,500/month | Included in MVS |
| APM (100 hosts) | $3,100/month | Included in MVS |
| Digital experience (RUM) | Per-session, separate SKU | Included in MVS |
| Platform license | Included above | $7,950/month (100 x $79.50) |
| Log management | ~$3,600/month (ingestion + indexing) | ~$350/month (1TB at $0.35/GB) |
| Incident management (5 responders) | Seat-based + external tools | ~$245-415/month (PagerDuty) |
| **Estimated monthly total** | **~$8,200–$12,000+/month** | **~$8,545–$8,715/month** |
At 100 hosts with moderate data volume, the platforms are surprisingly close in total cost. The gap opens in different directions depending on your workload: Datadog becomes much more expensive if you index most of your logs or have high RUM session volume. Instana becomes more expensive if your fleet grows significantly, because the per-MVS cost scales strictly linearly with host count while Datadog's base infrastructure cost per host is lower.
| Pricing factor | Datadog | IBM Instana |
|---|---|---|
| Free tier | No | No (14-day trial) |
| Minimum commitment | None | 10 MVS licenses |
| Infrastructure + APM bundled | No (separate charges) | Yes (Standard MVS rate) |
| High-water mark billing | Yes | No (monthly average) |
| Log management included | Yes (separate per-GB billing) | Add-on (separate per-GB) |
| Custom metric surcharges | Yes | No |
| Self-hosted option | No | Yes ($120/MVS, full parity) |
| OTel metric penalty | Yes (treated as custom) | No |
---
[summary]
### Enterprise observability without the multi-vendor model
Both Datadog and IBM Instana require separate tools for status pages and on-call scheduling, and both carry pricing that compounds at scale. Better Stack consolidates logs, metrics, traces, on-call scheduling, incident management, and status pages into one platform with one bill.
**Fewer vendors, fewer context switches, and a single place for the full reliability workflow.** [Talk to us.](https://betterstack.com)
[/summary]
---
## Security and compliance capabilities
This is an area where the platforms diverge, and where Instana holds several certifications that matter for specific regulated industries.
### Datadog: Cloud SIEM and a full security platform woven into observability

Datadog has a substantial security platform: Cloud SIEM for threat detection, Workload Protection for runtime kernel-level threat detection, App and API Protection against injection attacks, Code Security covering SAST/IAST/SCA and secret scanning, Cloud Security Posture Management, and Vulnerability Management. The integration between security signals and observability data is Datadog's core differentiator here.
### IBM Instana: compliance depth and self-hosted control
IBM Instana does not have a security platform. There is no SIEM, no threat detection, no code security product. What Instana does offer is a broader compliance portfolio than Datadog: SOC 2 Type II, FedRAMP authorization, and HIPAA compliance alongside GDPR. FedRAMP in particular is a hard requirement for US government agencies and contractors that Datadog only covers through its GovCloud offering. Instana's self-hosted option gives regulated organizations the ability to keep all telemetry data on-premises with full feature parity, something Datadog does not offer at all.
| Security and compliance | Datadog | IBM Instana |
|---|---|---|
| Cloud SIEM | Yes | No |
| Workload protection (runtime) | Yes | No |
| Code security (SAST/IAST/SCA) | Yes | No |
| Cloud security posture management | Yes | No |
| SOC 2 Type II | Yes | Yes |
| HIPAA | Yes | Yes |
| FedRAMP | Yes (GovCloud) | Yes |
| Data residency (self-hosted) | No | Yes (full feature parity) |
| Air-gapped deployment | No | Yes |
| Mainframe / IBM ecosystem | No | Yes |
---
## What each platform genuinely lacks
Being honest about gaps is how you avoid buyer's remorse.
**Datadog gaps worth knowing:**
- No free tier, evaluation requires a paid trial
- No self-hosted option; your telemetry data stays in Datadog's infrastructure permanently
- OpenTelemetry metrics treated as custom metrics, a significant cost penalty
- High-water mark billing means traffic spikes affect your bill for the whole month
- No status pages
- No 100% trace completeness guarantee (sampling applies)
- No mainframe or IBM Z monitoring
**IBM Instana gaps worth knowing:**
- No Cloud SIEM, no threat detection, no security monitoring product
- Log management is a separate add-on, not a core bundled product
- No status pages
- No built-in on-call scheduling or phone/SMS delivery
- No MCP server for external AI client access
- Minimum 10 MVS license commitment
- Self-hosted deployment costs more ($120/MVS) than cloud ($79.50/MVS)
- Agentic AI root cause analysis is still in Preview, not GA
- No network performance monitoring
- G2 reviewers flag the UI as complex and occasionally overwhelming for new users
---
## Final thoughts
Datadog and IBM Instana are both premium enterprise observability platforms, but they excel in different areas.
**Datadog is the better fit if you want the broadest platform and are willing to trade higher complexity and potentially higher costs for more functionality.** It combines observability, security, digital experience monitoring, AI integrations, and developer tooling in a single ecosystem. That makes it particularly appealing if you want to consolidate vendors and manage everything from one platform.
**Instana is the stronger option if trace completeness, deployment flexibility, or enterprise infrastructure support are your top priorities.** Its 100% unsampled tracing, self-hosted deployment model, FedRAMP authorization, and support for IBM Z and mainframe environments make it especially attractive for regulated industries and large enterprises with complex infrastructure requirements.
The cost difference is often smaller than many buyers expect once you account for what each platform includes. Datadog can be more cost-effective for smaller environments that benefit from its broader platform capabilities, while Instana often becomes more attractive in large-scale or compliance-heavy environments where tracing accuracy and deployment control carry more weight.
Whatever direction you choose, model your expected usage using each vendor's pricing calculator before signing a contract. Both platforms have pricing structures that can look very different in practice once log volumes, retention policies, and additional products are factored into the equation.
[summary]
### One thing neither covers: the full reliability layer
Neither Datadog nor IBM Instana includes uptime monitoring, unlimited phone/SMS on-call alerting, incident management, and customer-facing status pages in a unified product. Better Stack brings all of that together with logs, metrics, and traces, with usage-based pricing and no per-host fees.
**The full reliability lifecycle in one place. Start free, no credit card required.** [Try Better Stack.](https://betterstack.com)
[/summary]