# Datadog vs Honeycomb: A Complete Comparison for 2026
Most observability platforms have expanded by adding more features over time. **Datadog and Honeycomb took very different paths.** One set out to build the broadest observability platform possible. The other questioned whether the industry was solving the right problem in the first place.
**Honeycomb** was founded on the idea that production incidents can't always be predicted. Instead of encouraging teams to build dashboards and alerts for every possible failure, it focuses on **high-cardinality, wide events** that let engineers explore production data from any angle after something unexpected happens. Features like **BubbleUp** embody that philosophy by automatically highlighting the dimensions most closely associated with an anomaly, rather than expecting engineers to know where to look.
**Datadog** optimized for a different experience. It brings together APM, infrastructure monitoring, logs, real user monitoring, security, and AI into **a single platform with one agent and one backend**. The goal is to make investigations as seamless as possible, allowing engineers to move from an alert to traces, logs, and infrastructure metrics without changing tools or query languages. That breadth is one of Datadog's biggest strengths, although it also means costs tend to increase as more products are added.
Today, both companies are investing heavily in **AI-assisted observability**. Datadog offers **Bits AI SRE**, which can automatically investigate incidents when alerts fire, while Honeycomb has introduced **Canvas**, **Automated Investigations**, and one of the more mature MCP implementations in the observability market. AI is becoming an important part of both platforms, even if they continue to approach observability differently.
The biggest distinction, however, remains **scope**. Datadog aims to provide an end-to-end platform that covers observability, security, and incident response in one place. Honeycomb stays focused on **deep observability**, giving engineers powerful tools for exploring traces, logs, metrics, and frontend performance while relying on other products for areas like incident management, error tracking, session replay, and status pages.
This comparison isn't about deciding which philosophy is correct. It's about understanding **whether your team benefits more from an integrated platform that covers the entire operational workflow or a specialized observability tool designed for exploratory debugging at scale**.
## Quick comparison at a glance
| Feature | Datadog | Honeycomb |
|---|---|---|
| **Primary purpose** | Full-stack observability + security platform | Purpose-built observability engine |
| **Pricing model** | Per-host + per-GB + per-feature | Event-based (per event ingested) |
| **Free tier** | No | Yes (up to 20M events/month) |
| **APM / distributed tracing** | Yes (primary strength) | Yes (primary strength, BubbleUp) |
| **Log management** | Yes (two-tier billing) | Yes (event-based, added late 2024) |
| **Infrastructure metrics** | Yes | Yes (GA March 2026) |
| **Code-level profiling** | Yes (Continuous Profiler) | No |
| **Dynamic Instrumentation** | Yes | No |
| **BubbleUp anomaly detection** | No | Yes (signature feature) |
| **Real user monitoring** | Yes (browser + mobile) | Frontend Observability (no session replay) |
| **Session replay** | Yes | No |
| **Synthetic monitoring** | Yes | No |
| **Error tracking** | Yes | No (errors surface within traces/logs) |
| **SLO management** | Yes | Yes (built-in, query-driven, up to 100) |
| **Serverless APM** | Yes | Limited |
| **AI investigation** | Yes (Bits AI SRE, GA Dec 2025, fires on alert) | Yes (Canvas, Automated Investigations) |
| **MCP server** | Yes (Preview) | Yes (GA, Claude Code, Cursor, Amazon Q) |
| **AI agent monitoring (LLMs)** | Yes (Agent Observability) | Limited |
| **Cloud SIEM** | Yes (extensive) | No |
| **Workload protection** | Yes | No |
| **Code security (SAST/IAST/SCA)** | Yes | No |
| **Incident management** | Yes (seat-based add-on) | Not included (external tools) |
| **On-call scheduling** | Via Datadog On-Call or external | Not included |
| **Status pages** | No | No |
| **OTel support** | Partial (custom metric surcharge) | Yes (native, first-class) |
| **SOC 2 Type II** | Yes | Yes |
| **HIPAA** | Yes | Yes (BAA available) |
| **FedRAMP** | Yes (GovCloud) | No |
| **PCI DSS** | No | Yes |
---
## Platform architecture and philosophy
### Datadog: one agent, one proprietary backend, one investigation workflow

You install the Datadog Agent on every host, everything flows into Datadog's hosted infrastructure, and the investigation workflow is designed to be seamless. When an alert fires, you click from the alert to the trace to the surrounding logs to the infrastructure metrics without switching interfaces or query languages. Datadog controls the full pipeline from collection to storage to query, and that control is what makes cross-signal investigation feel natural.
The cost of that control is real and compounds. Per-host pricing for infrastructure, another per-host charge for APM, per-GB plus per-million-event billing for logs, a high-water mark billing model that sets your monthly rate at your peak host count, and custom metric surcharges when you use OpenTelemetry. Every product you enable adds another billing dimension. A team adding APM on top of infrastructure is not paying twice the infrastructure rate; in practice, APM adds $31 to $40 per host per month on top of the $15 to $23 already being charged.
### Honeycomb: columnar events, arbitrary queries, BubbleUp

Honeycomb stores all telemetry as wide events in a custom columnar data store optimized for high-cardinality queries. Every field on every event is queryable without pre-indexing, without schema declarations, and without cardinality penalties. A span can carry hundreds of custom fields (customer ID, feature flag, deployment version, experiment variant, region, tenant) and you can query across all of them at sub-second speeds. Gartner Peer Insights reviewers consistently praise the query speed and the freedom to add context without cost anxiety.
BubbleUp is Honeycomb's most distinctive capability. Select a region of anomalous data in a heatmap and BubbleUp automatically analyzes up to 2,000 attributes per span to surface which dimensions correlate most strongly with the anomaly. Instead of forming and testing hypotheses manually, BubbleUp tells you which combination of fields distinguishes the slow or failing requests from the baseline. It is one of the genuinely differentiated features in the observability space, and it saves real time during incident investigation.
The scope constraint is equally real. Honeycomb does not include incident management, on-call scheduling, phone alerting, session replay, standalone error tracking, status pages, or Cloud SIEM. Honeycomb's own engineering team uses PagerDuty for on-call and previously used Jeli for incident coordination. If you choose Honeycomb, you are choosing to build and maintain those adjacent vendor relationships separately.
| Architectural factor | Datadog | Honeycomb |
|---|---|---|
| Data collection | Proprietary DD Agent | OTel SDKs (manual per service) |
| Storage | Proprietary SaaS backend | Columnar data store (wide events) |
| Query language | Proprietary DQL + some PromQL | Honeycomb query builder (proprietary) |
| OTel support | Partial (custom metric surcharge) | Native, first-class (no surcharge) |
| High-cardinality support | Yes (custom metric charges apply) | Yes (core design, no penalty) |
| BubbleUp anomaly attribution | No | Yes (signature feature) |
| Investigation workflow | Single view, click-through | Query builder, BubbleUp analysis |
| Scope | Full platform (observability + security) | Observability only (traces, logs, metrics, frontend) |
| Vendor lock-in risk | High (proprietary agent + format) | Medium (proprietary query language, OTel format) |
[summary]
### Neither Datadog nor Honeycomb covers the full reliability picture
Both platforms focus on observability and investigation. Neither includes built-in on-call scheduling with phone and SMS delivery or customer-facing status pages as part of the core product. Better Stack brings all of that together alongside logs, metrics, and traces, so you can go from alert to post-mortem without switching tools.
**From heartbeat monitoring to incident timelines to status pages, one platform for the whole reliability lifecycle.** [Start free.](https://betterstack.com)
[/summary]
---
## APM and distributed tracing
Both platforms have genuine APM depth. Datadog's is broader in tooling coverage. Honeycomb's is more powerful for ad-hoc investigation of high-cardinality trace data.
### Datadog: agent-based APM with the deepest tooling in the category
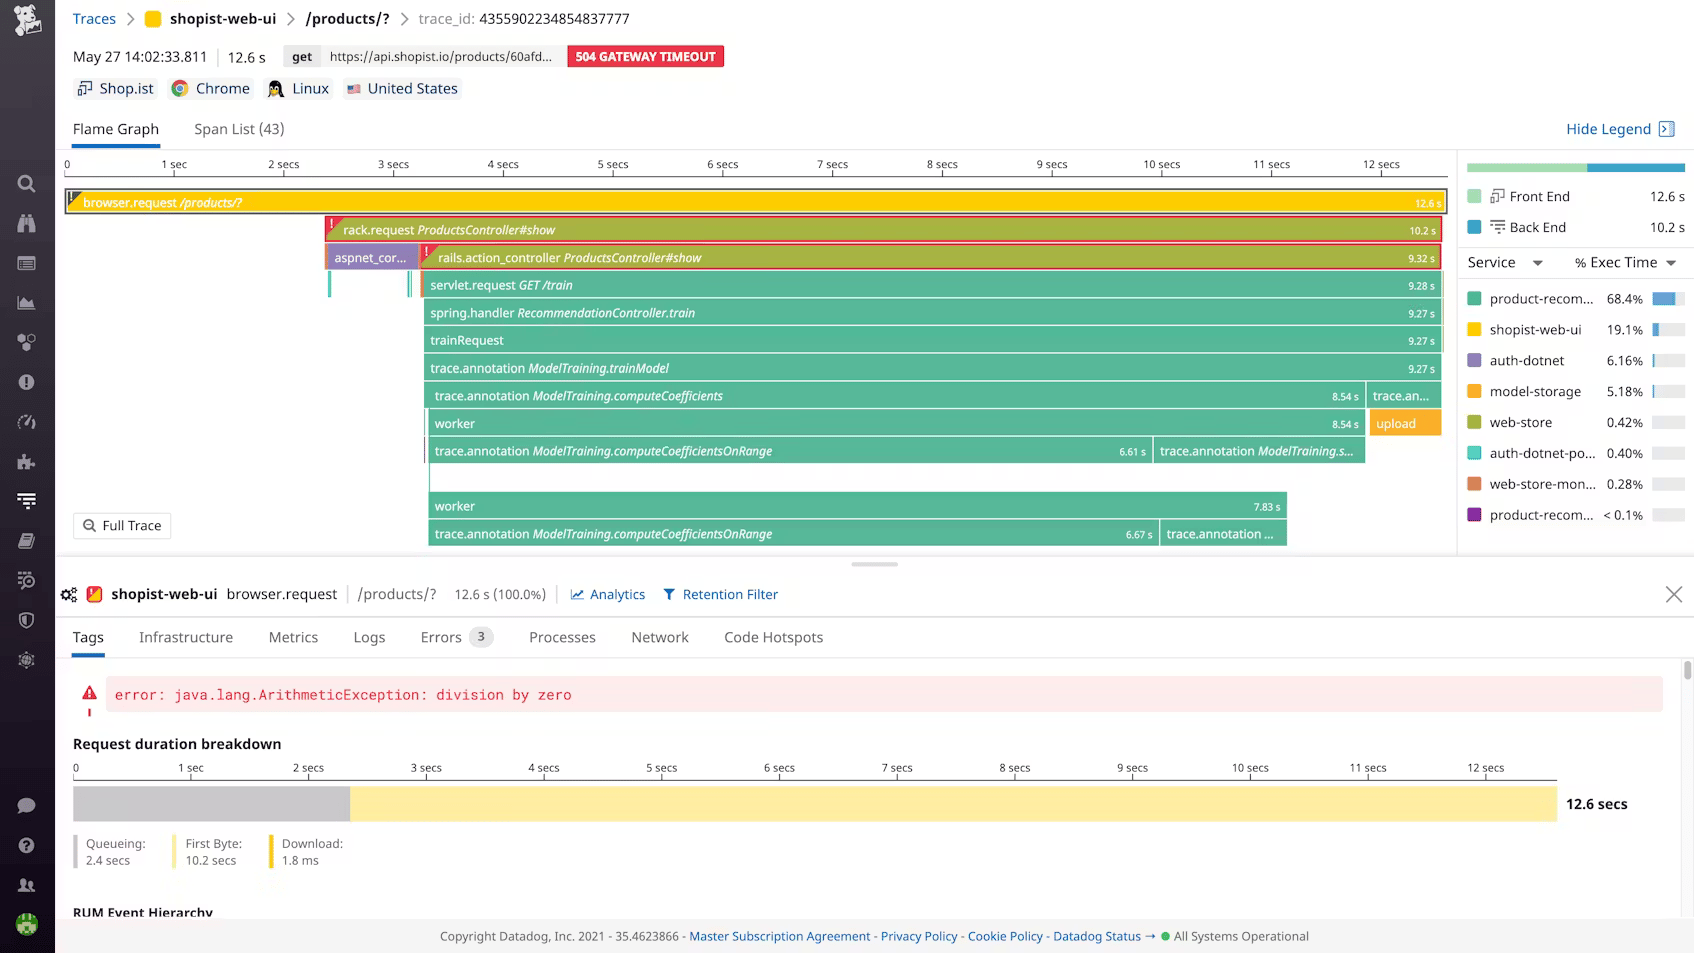
Datadog APM covers service maps, Continuous Profiler for code-level CPU and memory attribution per function, Dynamic Instrumentation for adding log lines and metrics to running production services without redeploying, and Watchdog for automatic anomaly detection. The frontend-to-backend correlation is seamless because RUM and APM share the same backend.
APM costs $31 to $40 per host per month on top of the base infrastructure fee. High-throughput microservices regularly exceed the included span limits. OTel instrumentation triggers custom metric charges, which means teams invested in vendor-neutral instrumentation pay a premium for that choice on Datadog.
### Honeycomb: wide-event tracing with BubbleUp-powered investigation

Honeycomb's tracing is built around the wide-event model and carries no cardinality penalty for custom fields. The Service Map provides a dynamic, query-driven view of service dependencies. Waterfall views show exactly which services contribute latency across complex request flows. BubbleUp runs on trace data, automatically surfacing which span attributes correlate with the anomalous region you select in a heatmap.
The investigation advantage Honeycomb has over Datadog is investigative flexibility at the attribute level. When something goes wrong in a way you did not predict, you can attach whatever context is relevant to your spans and query across it immediately. Datadog's investigation is smoother for cross-signal navigation (alert to trace to logs to infra in one view), but more constrained when you need to drill into high-cardinality business dimensions that were not part of your original monitoring design.
The instrumentation reality: Honeycomb requires OTel SDKs installed in every service with per-language configuration and ongoing library maintenance. For a polyglot environment running five or six different languages, that is real engineering overhead that accumulates over time. Datadog's proprietary agent instruments automatically, though the OTel surcharge applies if you go the vendor-neutral route.
| APM / tracing | Datadog | Honeycomb |
|---|---|---|
| Instrumentation | Proprietary SDK per service | OTel SDKs (manual per service) |
| OTel support | Yes (custom metric surcharge) | Yes (native, first-class, no surcharge) |
| Code-level profiling | Yes (Continuous Profiler) | No |
| Dynamic Instrumentation | Yes | No |
| BubbleUp anomaly attribution | No | Yes (signature feature) |
| High-cardinality custom fields | Yes (cardinality charges apply) | Yes (unlimited, no penalty) |
| Frontend-to-backend correlation | Seamless (shared backend) | Via Frontend Observability (Enterprise) |
| APM pricing | $31–$40/host/month (on top of infra) | Event-based (included in event pool) |
[summary]
### APM without the per-host bill
Both Datadog and Honeycomb charge for APM in ways that compound with usage. Better Stack's tracing is priced by data volume with no span indexing fees, no per-host charges, and no cardinality penalties, and the AI SRE activates automatically during incidents to investigate root cause before you have to ask.
**Full-fidelity distributed tracing from every service, priced by volume with no surprises.** [Explore Better Stack tracing.](https://betterstack.com/tracing)
[/summary]
---
## Log management
This is where Datadog's billing model is most concrete in its impact, and where Honeycomb's newer log analytics represents a meaningfully different architectural choice.
### Datadog: excellent query experience, expensive at scale
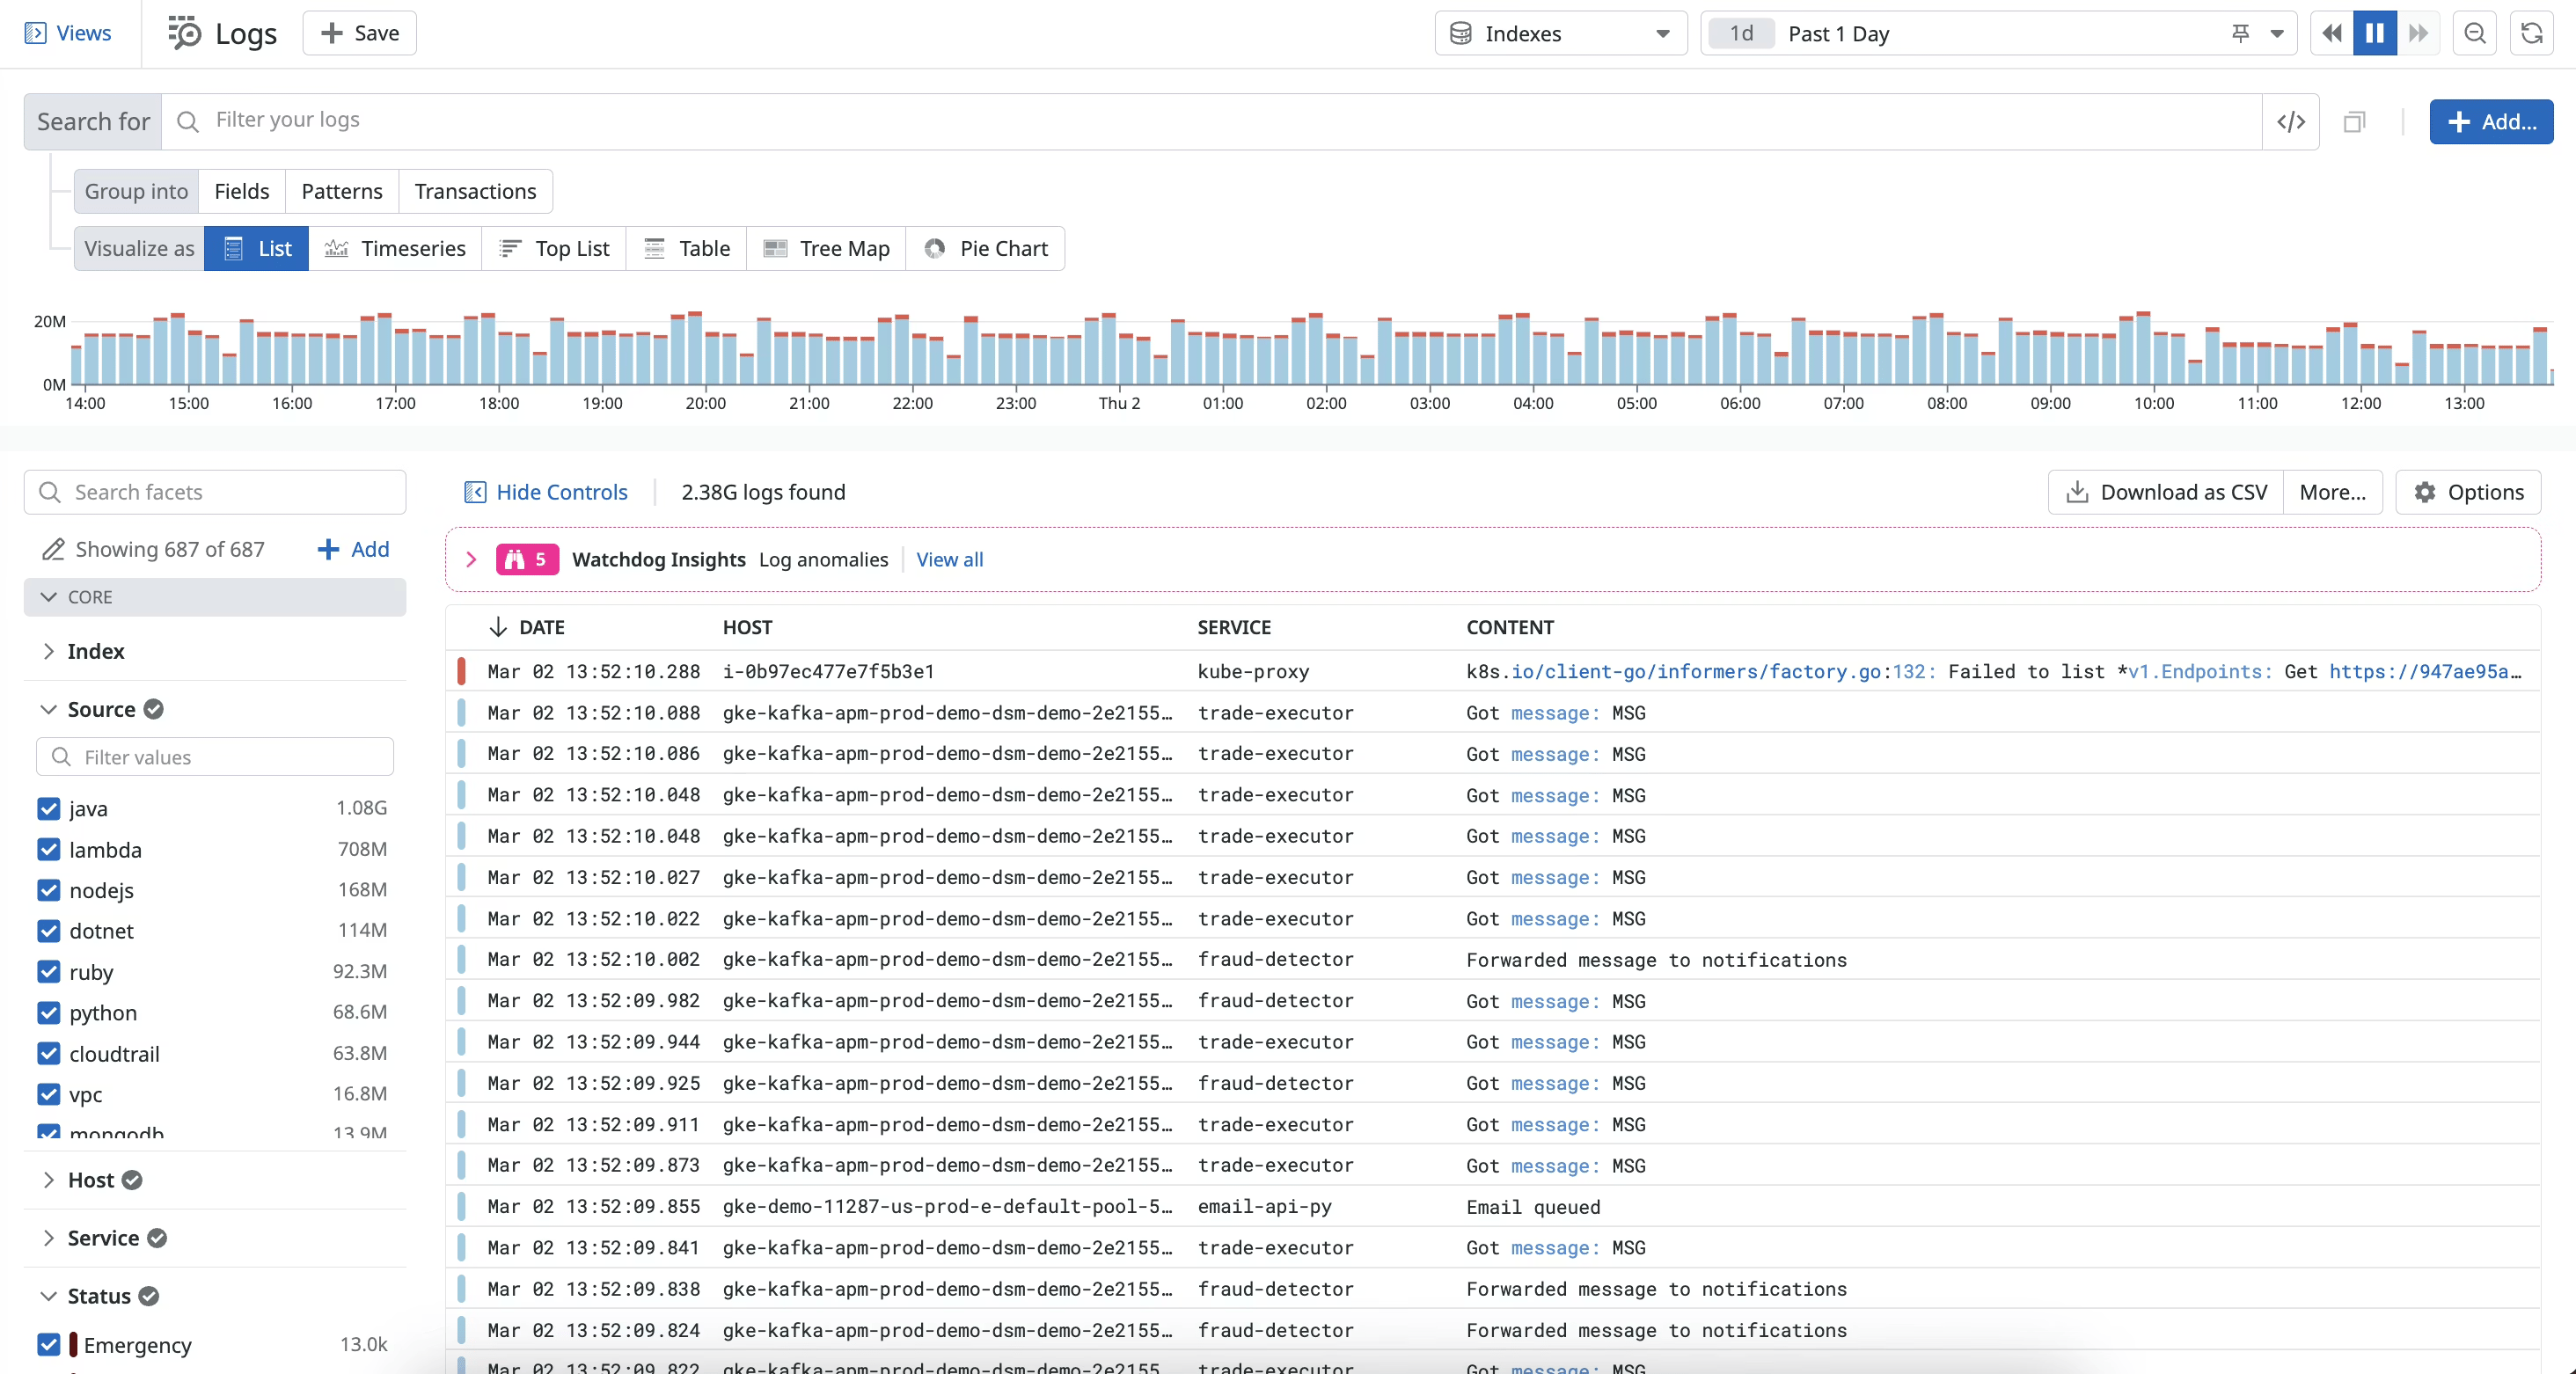
Datadog uses a two-tier billing model for logs: $0.10/GB for ingestion regardless of whether you ever search those logs, then $1.70 per million events to index them and make them queryable. Most teams ingest everything and index selectively, which means a portion of logs are always sitting in archive, invisible for ad-hoc investigation unless you pay to rehydrate them. At 100 GB/day, the Datadog log bill alone approaches $107,000 per year.
The query experience is genuinely strong: faceted search, Log Patterns clustering, Sensitive Data Scanner, and seamless trace correlation because everything shares the same backend.
### Honeycomb: event-based log analytics with BubbleUp

Honeycomb for Log Analytics, launched in late 2024, treats logs as structured events in the same columnar store as traces. Every log field is queryable without pre-indexing, and BubbleUp works on log data the same way it works on traces. From any log event, one click takes you to the associated trace.
The important architectural nuance: Honeycomb's log analytics works best with well-structured JSON events. Unstructured logs, legacy application output, and mixed-format streams require pre-processing via Honeycomb Telemetry Pipeline before ingestion. Pipeline Intelligence (launched March 2026) uses AI to automatically detect log types and build parsing pipelines, which meaningfully reduces this friction. But it remains a step that Datadog's log ingestion handles more transparently.
The pricing comparison is stark: Datadog charges $0.10/GB for ingestion plus $1.70 per million events to make them searchable. Honeycomb's log data shares the same event pool as traces, with no separate indexing decision and no archive tier.
| Log management | Datadog | Honeycomb |
|---|---|---|
| Billing model | $0.10/GB ingestion + $1.70/million events indexed | Event-based (shared pool with traces) |
| All logs searchable | Indexed subset only | Yes (structured events) |
| Archive / rehydration | Yes (rehydration cost) | No archive tier |
| Unstructured log handling | Native | Requires Pipeline processing |
| BubbleUp on logs | No | Yes |
| Trace correlation | Seamless (same backend) | Automatic (same data store) |
[summary]
### Log search with no indexing tax
Both Datadog and Honeycomb have pricing structures that produce surprises at scale. Better Stack stores logs in a unified warehouse with SQL querying, no separate indexing layer, and no per-event charges. You pay for what you send, and all of it is searchable.
**Unified log management with SQL search, live tail, and no indexing surprises.** [See how it works.](https://betterstack.com/logs)
[/summary]
---
## Infrastructure monitoring and cloud metrics
Both platforms monitor infrastructure comprehensively, but their approaches to cardinality and pricing differ in ways that matter at scale.
### Datadog: comprehensive fleet visibility on a stacking per-host model

Datadog infrastructure monitoring starts at $15/host/month on Pro and that is the foundation on which APM, database monitoring, and network monitoring all stack. Kubernetes monitoring is deep. Network Performance Monitoring tracks service-to-service traffic flows. High-water mark billing means a five-day traffic spike sets your billing rate for the full month. OTel metrics are treated as custom metrics with surcharges beyond the per-host allotment.
### Honeycomb: metrics derived from wide events, no cardinality penalty
Honeycomb Metrics reached general availability in March 2026 and takes an unconventional approach: metrics are derived from the same wide events that store traces and logs rather than being stored in a separate time series database. Every span field can become a queryable metric, and BubbleUp works across metrics data the same way it does across traces. Promotional pricing starts at $2 per 1,000 time series per month.
The cardinality contrast is concrete. On Datadog, adding high-cardinality tags (customer_id, deployment_version) to metrics triggers custom metric surcharges beyond the per-host allotment. On Honeycomb, the same tags are fields on wide events with no billing penalty. Teams that have hesitated to add useful dimensions to their metrics because of cost anxiety on Datadog find that constraint simply doesn't exist in Honeycomb's model.
Honeycomb Metrics is newer, and teams with mature Prometheus pipelines relying on full PromQL compatibility will find Datadog more immediately usable. Honeycomb's query model is different from PromQL, and the Prometheus-native integration ecosystem is less established.
| Infrastructure monitoring | Datadog | Honeycomb |
|---|---|---|
| Pricing | Per-host ($15–$23/month) | Per 1,000 time series/month (event-derived) |
| High-water mark billing | Yes | No |
| Custom metric / cardinality surcharges | Yes (OTel + beyond allotment) | No |
| PromQL support | Yes | Limited (different query model) |
| Kubernetes monitoring | Yes (deep) | Via OTel instrumentation |
| Network Performance Monitoring | Yes (NPM product) | No |
| Metrics maturity | Established | GA March 2026 |
[summary]
### Infrastructure metrics connected to the full reliability workflow
Both Datadog and Honeycomb charge for infrastructure telemetry in ways that scale with your fleet or event volume. Better Stack takes a different approach: no per-host fees, no cardinality penalties, and infra metrics that live alongside uptime monitors, on-call schedules, and incident timelines.
**Infrastructure monitoring connected to alerting, on-call, and incident management, all in one place.** [Get started free.](https://betterstack.com)
[/summary]
---
## Digital experience monitoring
Datadog has a mature, full-featured DEM suite and is a two-time consecutive Gartner Magic Quadrant Leader for digital experience monitoring. Honeycomb's Frontend Observability is a focused performance debugging tool, not a traditional RUM product.
### Datadog: full digital experience suite

Browser RUM, Mobile RUM across iOS, Android, React Native, and Flutter, Session Replay, Synthetic Monitoring, Product Analytics, and Experiments. Frontend-to-backend correlation is seamless because RUM and APM share the same backend. Each component is a separate line item.
### Honeycomb: BubbleUp-powered CWV debugging, no session replay

Honeycomb for Frontend Observability captures Core Web Vitals with BubbleUp attribution. An OTel-based NPM package collects CWV data and BubbleUp analyzes which elements, scripts, and page characteristics correlate with poor LCP, CLS, or INP scores. The React Native SDK in beta extends to mobile for Enterprise customers.
What this is: a powerful debugging tool for understanding why Core Web Vitals are poor and which user segments are experiencing degraded performance. What this is not: session replay, product analytics, funnel analysis, website analytics with UTM tracking, synthetic monitoring from global locations, or traditional RUM dashboards tracking user counts and engagement. If those capabilities matter for your product and UX teams, Datadog has them and Honeycomb does not.
| Digital experience | Datadog | Honeycomb |
|---|---|---|
| Browser RUM | Yes (Gartner DEM Leader, 2x) | CWV with BubbleUp attribution (Enterprise) |
| Mobile RUM | Yes (iOS, Android, React Native, Flutter) | React Native beta (Enterprise) |
| Session replay | Yes | No |
| Synthetic monitoring | Yes | No |
| Product analytics | Yes | No |
| BubbleUp for CWV | No | Yes (differentiator) |
---
## AI capabilities
Both companies have made serious AI investments, and both have MCP servers. The orientation differs significantly: Datadog's flagship AI fires proactively at alert time. Honeycomb's AI suite is deeper in investigation tooling and more mature in the in-product investigation experience.
### Datadog Bits AI: autonomous investigation that fires without prompting

Datadog's Bits AI SRE went GA in December 2025. When an alert fires, it starts investigating immediately without waiting for anyone to prompt it: querying traces, reviewing logs, checking recent deployments, producing a root-cause hypothesis. By the time you open your laptop, the investigation is already in progress. Beyond Bits AI SRE, there is Bits Chat for conversational queries, Bits Code for in-editor help, Bits Security Analyst for SIEM triage, and an MCP Server in Preview for Claude and Cursor integration.
### Honeycomb Intelligence: Canvas, Automated Investigations, and the most mature MCP in observability
Honeycomb's AI suite is a collection of four components that together represent one of the more thoughtful AI implementations in the observability space.
Canvas is an embedded AI copilot that answers natural-language observability questions, generates queries, surfaces insights, and guides investigations with chain-of-thought reasoning showing exactly which tool calls were made. The Canvas Slackbot extends this into Slack channels. Unlike Datadog's Bits Chat, Canvas shows its reasoning transparently, which builds trust in AI-generated conclusions during incident investigation.
Automated Investigations (early access) activate when an alert fires or an SLO burns, autonomously conducting investigations and recommending solutions using the same playbooks your best SREs would follow. This is the closest Honeycomb comes to Datadog's proactive Bits AI SRE.
The Honeycomb MCP server is GA and connects Cursor, Claude Code, and Amazon Q Developer directly to your observability data. Agent Skills for Claude Code and Cursor extend to instrumentation help (migrating legacy telemetry to OTel) and production investigation workflows. Case studies highlight real production value: a Fortune 500 retailer used it for real-time Black Friday insights, a streaming service connected Honeycomb and Slack MCPs to surface root cause from support requests.
Anomaly Detection proactively learns what normal looks like for your applications and surfaces genuine issues without manual threshold configuration.
The trigger difference matters at 3am: Datadog's Bits AI SRE fires autonomously the moment an alert triggers. Honeycomb's Automated Investigations also fire autonomously but remain in early access. Canvas is available now but requires you to initiate the conversation.
| AI capability | Datadog | Honeycomb |
|---|---|---|
| Autonomous investigation (fires on alert) | Yes (Bits AI SRE, GA Dec 2025) | Automated Investigations (early access) |
| In-product AI copilot | Yes (Bits Chat) | Yes (Canvas, deeper, shows reasoning) |
| MCP server | Yes (Preview) | Yes (GA, Claude Code, Cursor, Amazon Q) |
| Agent Skills for instrumentation | No | Yes (Claude Code, Cursor) |
| Anomaly detection | Watchdog (alert-driven) | Yes (proactive, zero-config) |
| Slack AI integration | No | Canvas Slackbot |
| Chain-of-thought reasoning | No | Yes (Canvas) |
| AI for security | Yes (Bits Security Analyst) | No |
[summary]
### AI that also wakes someone up
Both Datadog and Honeycomb have AI investigation features. What neither one includes is a direct path from a root cause hypothesis to an on-call notification, an incident timeline, and a customer-facing status page update. Better Stack's AI SRE connects to the full incident lifecycle so the investigation and the response happen in the same place.
**Autonomous root cause investigation connected to on-call, incidents, and status pages.** [See the AI SRE.](https://betterstack.com)
[/summary]
---
## Security capabilities
Security is where Datadog has a large and genuine advantage, and where the comparison ends quickly if security operations is part of your evaluation.
Datadog has built a serious security platform: Cloud SIEM for threat detection across logs and cloud audit trails, Workload Protection for runtime kernel-level threat detection, App and API Protection against injection attacks and account takeover, Code Security covering SAST, IAST, SCA, IaC scanning, and secret detection, Cloud Security Posture Management, and Vulnerability Management. The integration between security signals and observability data is Datadog's core differentiator here: a security alert and the APM trace that triggered it live in the same system.

Honeycomb has no security product. No SIEM, no threat detection, no workload protection, no code security. Honeycomb's compliance posture covers SOC 2 Type II, HIPAA (with BAA), and PCI DSS. FedRAMP is not available. If your evaluation includes security monitoring, Cloud SIEM, or runtime threat detection, Honeycomb is not in that conversation.
The one compliance area where Honeycomb has an edge: PCI DSS certification, which Datadog does not currently hold in its standard portfolio. For financial services teams where PCI DSS is a procurement requirement, that matters.
| Security | Datadog | Honeycomb |
|---|---|---|
| Cloud SIEM | Yes | No |
| Workload protection (runtime) | Yes | No |
| Code security (SAST/IAST/SCA) | Yes | No |
| SOC 2 Type II | Yes | Yes |
| HIPAA | Yes | Yes (BAA available) |
| FedRAMP | Yes (GovCloud) | No |
| PCI DSS | No | Yes |
---
## Incident management and alerting
Datadog comes closer to owning the incident response workflow with Datadog On-Call. Honeycomb covers alerting and SLOs and stops before paging.
### Datadog: seat-based incident management with Bits AI acceleration
Datadog's alerting covers metrics thresholds, log patterns, trace error rates, and uptime checks, with ML-based anomaly detection. Incident management is a seat-based SKU covering declaration, responder assignment, timeline management, and Slack/Teams integration. On-call scheduling is available through Datadog On-Call or PagerDuty and OpsGenie integrations.
### Honeycomb: triggers and SLOs, no incident management
Honeycomb's triggers fire when query conditions are met, and SLOs track error budgets with up to 100 SLOs on Enterprise, query-driven so you can define objectives on any field combination rather than just pre-defined metrics. When a trigger fires, it sends a webhook to an external system.
What is not included: on-call scheduling, escalation policies, phone and SMS delivery, post-mortem generation. Honeycomb's own engineering team uses PagerDuty for on-call. For five responders on PagerDuty Professional, that adds $245 to $415 per month on top of Honeycomb's event costs. Datadog's native On-Call avoids that separate vendor, though it is an add-on.
| Incident management | Datadog | Honeycomb |
|---|---|---|
| Native incident management | Yes (seat-based) | No (webhooks only) |
| On-call scheduling | Via Datadog On-Call or external | Not included |
| Phone/SMS delivery | Via Datadog On-Call or external | Not included |
| SLO management | Yes | Yes (query-driven, up to 100 SLOs) |
| Status pages | No | No |
---
## Pricing comparison
The pricing comparison is directionally significant, but Honeycomb's event-based model produces different outcomes depending on data density and query frequency.
### Datadog: per-host plus per-feature compounding

Infrastructure at $15 to $23 per host per month, APM at $31 to $40 per host per month on top of that, log ingestion at $0.10/GB, log indexing at $1.70 per million events, custom metrics beyond the per-host allotment at $1 per 100. High-water mark billing means a traffic spike sets your billing rate for the full month.

A 100-host deployment with APM, logs, and RUM commonly runs $20,000 to $30,000 per month.
### Honeycomb: event-based, observability-only
Honeycomb uses event-based pricing: up to 20M events per month free on the community plan, starting at $130/month for 100M events on Pro, with Enterprise pricing from a 10 billion event per year base allowance. Metrics add $2 per 1,000 time series per month at promotional rates.
What is not included (and what you pay separately): PagerDuty for on-call ($245 to $415/month for five responders), Sentry or similar for error tracking ($26 to $80/month), and Statuspage.io if needed ($79 to $399/month).
**Rough cost comparison: 100 hosts, 2.5TB/month combined telemetry**
| Cost component | Datadog (Pro, annual) | Honeycomb (Enterprise est.) |
|---|---|---|
| Infrastructure monitoring | $1,500/month | Included in event pricing |
| APM | $3,100/month | Included in event pricing |
| Log ingestion + indexing | ~$3,600/month | Included in event pricing |
| Metrics | Surcharges apply | ~$200/month ($2/1,000 time series) |
| Platform (event-based) | N/A | Enterprise negotiated (volume-based) |
| On-call (5 responders) | Datadog On-Call or PagerDuty | PagerDuty (~$245-415/month) |
| Error tracking | Included | Sentry (~$26-80/month) |
| Session replay / RUM | Separate SKU | Not available |
| **Estimated monthly total** | **~$8,200+/month** | **Enterprise + $271-495/month tooling** |
The Honeycomb total depends heavily on negotiated Enterprise rates and event volume. At moderate scale, Honeycomb is typically cheaper than Datadog's full stack, but the mandatory external tooling adds fixed costs. The gap narrows significantly once you account for PagerDuty and Sentry alongside Honeycomb.
| Pricing factor | Datadog | Honeycomb |
|---|---|---|
| Free tier | No | Yes (20M events/month) |
| Per-host fee | Yes ($15–$23/month) | No |
| APM on top of infra | Yes ($31–$40/host) | No (event-based) |
| Cardinality penalties | Yes (custom metrics) | No |
| OTel metric surcharges | Yes | No |
| High-water mark billing | Yes | No |
| Error tracking included | Yes | No (external) |
| On-call included | Via On-Call add-on | Not included |
[summary]
### Enterprise observability without the multi-vendor model
Both Datadog and Honeycomb require separate tools for on-call scheduling and status pages. Better Stack consolidates logs, metrics, traces, on-call scheduling, incident management, and status pages into one platform with one bill.
**Fewer vendors, fewer context switches, and a single place for the full reliability workflow.** [Talk to us.](https://betterstack.com)
[/summary]
---
## What each platform genuinely lacks
**Datadog gaps worth knowing:**
1. No free tier; evaluation requires a paid trial.
2. High-water mark billing can move your invoice unexpectedly from traffic spikes.
3. OpenTelemetry metrics treated as custom metrics with surcharges.
4. No BubbleUp-equivalent for automated anomaly attribution in traces.
5. No PCI DSS compliance in the standard portfolio.
6. No status pages.
7. Honeycomb's Canvas AI investigation experience is more mature and transparent than Datadog's current in-product AI tooling.
8. MCP server remains in Preview while Honeycomb's is GA.
**Honeycomb gaps worth knowing:**
1. No incident management, on-call scheduling, or phone/SMS delivery.
2. No status pages.
3. No session replay or traditional product analytics RUM.
4. No standalone error tracking with issue assignment workflows.
5. No synthetic monitoring from global locations.
6. No Cloud SIEM, workload protection, or code security.
7. No FedRAMP authorization.
8. Metrics product is new (GA March 2026) with less established Prometheus-native integration.
9. Unstructured logs require pre-processing before ingestion.
10. Frontend Observability is Enterprise-only.
11. Proprietary query language means investigation skills don't transfer.
---
## Final thoughts
The longer you compare these platforms, **the less it feels like you're choosing between two observability tools and the more it feels like you're choosing between two ways of running engineering.** One prioritizes breadth and consolidation. The other prioritizes depth and exploration.
If your goal is to bring **observability, security, and incident response into a single platform**, Datadog is the stronger choice. Cloud SIEM, workload protection, code security, AI investigations, and a seamless workflow from alerts to traces, logs, and infrastructure metrics make it one of the most comprehensive platforms on the market. For teams trying to reduce the number of tools they manage, that breadth has real operational value.
Honeycomb takes a different approach. Instead of expanding into every adjacent category, it continues to invest in **making observability itself better**. If your team relies on high-cardinality telemetry and regularly investigates problems that can't be anticipated with predefined dashboards, Honeycomb offers one of the best experiences available. Features like **BubbleUp**, **Canvas**, and its mature MCP implementation are designed for engineers who want to explore production systems rather than follow predefined investigation paths.
That focus comes with tradeoffs. Honeycomb deliberately leaves capabilities like **on-call scheduling, incident management, error tracking, session replay, and status pages** to other products. For teams that already use tools like PagerDuty and Sentry, that narrower scope is often an advantage because you're free to choose the best tool for each job. For organizations looking to consolidate vendors, however, Datadog's all-in-one approach is likely to be the better fit.
Ultimately, **the right choice depends on whether you value consolidation or specialization**. If you want one platform to support most of your production operations, Datadog is difficult to beat. If you already have the surrounding tooling and want one of the deepest observability products available, Honeycomb remains one of the strongest options in the market.
[summary]
### One thing neither covers: the full reliability layer
Neither Datadog nor Honeycomb includes uptime monitoring, unlimited phone/SMS on-call alerting, incident management, and customer-facing status pages in a unified product. Better Stack brings all of that together with logs, metrics, and traces, with usage-based pricing and no per-host fees.
**The full reliability lifecycle in one place. Start free, no credit card required.** [Try Better Stack.](https://betterstack.com)
[/summary]