# Datadog vs groundcover: A Complete Comparison for 2026
If you are trying to escape Datadog's bill without losing production visibility, you have probably encountered groundcover as one of the most frequently recommended alternatives. Both platforms cover the core observability stack: APM, log management, infrastructure metrics, and increasingly AI-powered investigation. But they approach the problem from opposite directions, and the choice between them comes down to one fundamental question: does your telemetry data have to stay inside your own cloud?
**Datadog is the integrated SaaS platform** that enterprises have standardized on for a decade. It is broad, deeply integrated, and genuinely impressive in feature coverage. It is also expensive in ways that compound fast across per-host, per-GB, and per-feature billing dimensions.
**groundcover is the BYOC-native observability platform** built around two bets: eBPF for zero-code data collection, and your own AWS or GCP VPC for data storage. Pricing is per monitored node rather than per GB ingested, which eliminates the bill-shock dynamic that drives teams away from Datadog in the first place.
Neither is right for every team. **Datadog has things groundcover simply has not built yet:** Cloud SIEM, network performance monitoring, session replay, synthetic monitoring, status pages, built-in incident management with on-call scheduling and phone/SMS delivery, and support for environments beyond Kubernetes. **groundcover has things Datadog cannot offer:** a BYOC architecture where your telemetry never leaves your cloud, per-node pricing that stays flat regardless of data volume, and AI inference running inside your own AWS infrastructure on Bedrock.
This article covers both tools across architecture, APM, log management, infrastructure monitoring, AI capabilities, pricing, and enterprise readiness.
## Quick comparison at a glance
| Feature | Datadog | groundcover |
|---|---|---|
| **Deployment model** | SaaS only | BYOC (runs in your AWS/GCP VPC) |
| **Data storage** | Datadog-hosted | Always in your own cloud |
| **Instrumentation** | Proprietary agent + SDK per service | eBPF (zero code changes) |
| **Pricing model** | Per-host + per-GB + per-million events | Per node/month (data volume agnostic) |
| **Free tier** | No | Yes (12-hour retention, community support) |
| **Starting price** | $15/host/month (infra only) | $30/host/month (Pro, all features) |
| **Custom metric surcharges** | Yes ($1/100 beyond allotment) | No |
| **OTel-native** | Partial (prefers DD Agent) | Yes (first-class) |
| **APM / distributed tracing** | Yes | Yes |
| **Log management** | Yes (two-tier billing) | Yes (volume agnostic, BYOC) |
| **Infrastructure metrics** | Yes | Yes |
| **Kubernetes monitoring** | Yes | Yes (primary use case) |
| **Cloud monitoring (AWS/Azure/GCP)** | Yes | Yes |
| **Real user monitoring** | Yes (browser + mobile) | Yes (GA) |
| **Session replay** | Yes | Yes (GA) |
| **Synthetic monitoring** | Yes | Yes (GA) |
| **LLM observability** | Yes (Agent Observability) | Yes (eBPF-based, zero instrumentation) |
| **AI SRE / investigation** | Yes (Bits AI SRE, autonomous) | Yes (AI Mode + Agent Mode on Bedrock) |
| **MCP server** | Yes (Preview) | Yes (active development) |
| **Incident management** | Yes (seat-based add-on) | No (integrate PagerDuty/OpsGenie) |
| **Status pages** | No | No |
| **On-call scheduling** | Via Datadog On-Call or external | Not included |
| **Cloud SIEM / security** | Yes (extensive) | No |
| **Network monitoring** | Yes | Limited |
| **SOC 2 Type II** | Yes | Yes |
| **ISO 27001** | Yes | Yes |
| **HIPAA** | Yes | Yes (BYOC data plane) |
| **FedRAMP** | Yes (GovCloud) | No |
| **Air-gapped deployment** | No | Yes (On-Premise tier) |
---
## Platform architecture and philosophy
The architectural difference between these two platforms is the comparison. Everything else flows from it.
### Datadog: proprietary SaaS with tight cross-signal integration

Datadog is built on a proprietary agent and a proprietary data model. You install the Datadog Agent on every host, it collects metrics, logs, and traces, and ships them to Datadog's hosted infrastructure. The integration is tight by design: data from a Kubernetes pod, a database query, a browser session, a CI pipeline run, and a security alert all land in one system. Correlating across those signal types is seamless because Datadog controls the entire pipeline from collection to storage to query.
The tradeoff is total lock-in. Your data lives in Datadog's systems in Datadog's format. Your dashboards are built in Datadog's query language. If you decide to move, you are looking at re-instrumenting your entire stack. And OpenTelemetry data gets treated as custom metrics, which means you pay extra for following the open standard.
### groundcover: BYOC-native with eBPF at the kernel level

groundcover's defining architectural decision is that it was built BYOC-first. Every deployment runs inside the customer's own AWS or GCP account. There is a separation between the control plane (groundcover's cloud, handles metadata, routing, and user management) and the data plane (your cloud, handles ingest, processing, and storage via ClickHouse and VictoriaMetrics). Your observability data, including sensitive log contents and full LLM payloads, never leaves your cloud.
The eBPF sensor runs as a DaemonSet on your Kubernetes nodes, collecting logs, metrics, traces, and Kubernetes events from the kernel with zero code changes. Linux hosts outside Kubernetes are also supported, though the platform is firmly Kubernetes-first in its documentation, deployment guides, and UI.
The tradeoff is infrastructure overhead. You pay for the VPC resources running the data plane, and provisioning takes hours rather than minutes. For a medium-scale 450-node deployment, groundcover's own TCO calculator shows roughly $23,000/year in BYOC hosting (EC2, EBS, S3) on top of the platform license.
| Architectural factor | Datadog | groundcover |
|---|---|---|
| Data storage location | Datadog-hosted | Your own VPC |
| Instrumentation | Proprietary agent + SDK per service | eBPF (kernel-level, zero code) |
| Storage engine | Proprietary | ClickHouse + VictoriaMetrics |
| Query language | Proprietary (DQL) + some PromQL | SQL + PromQL |
| Runtime requirement | Any environment | Kubernetes-first (Linux hosts also supported) |
| Infrastructure overhead | None (fully managed SaaS) | Your VPC resources (managed by groundcover) |
| Time to first insight | Minutes after agent install | Hours (BYOC provisioning + sensor deploy) |
| Vendor lock-in risk | High (proprietary format + agent) | Low (OTel-native, open storage) |
[summary]
### Neither Datadog nor groundcover covers the full reliability picture
Both platforms focus on telemetry. Neither includes built-in uptime monitoring, on-call scheduling with phone and SMS delivery, or customer-facing status pages as part of the core product. Better Stack brings all of that together in one place alongside logs, metrics, and traces, so you can go from alert to post-mortem without switching tools.
**From heartbeat monitoring to incident timelines to status pages, one platform for the whole reliability lifecycle.** [Start free.](https://betterstack.com)
[/summary]
---
## APM and distributed tracing
Both platforms use eBPF for zero-code instrumentation, which is already a meaningful shared advantage over traditional agent-based tools. The differences come down to environment coverage, where the trace data lives, and the depth of cross-signal correlation.
### Datadog: agent-based APM with deep profiling and a per-host bill
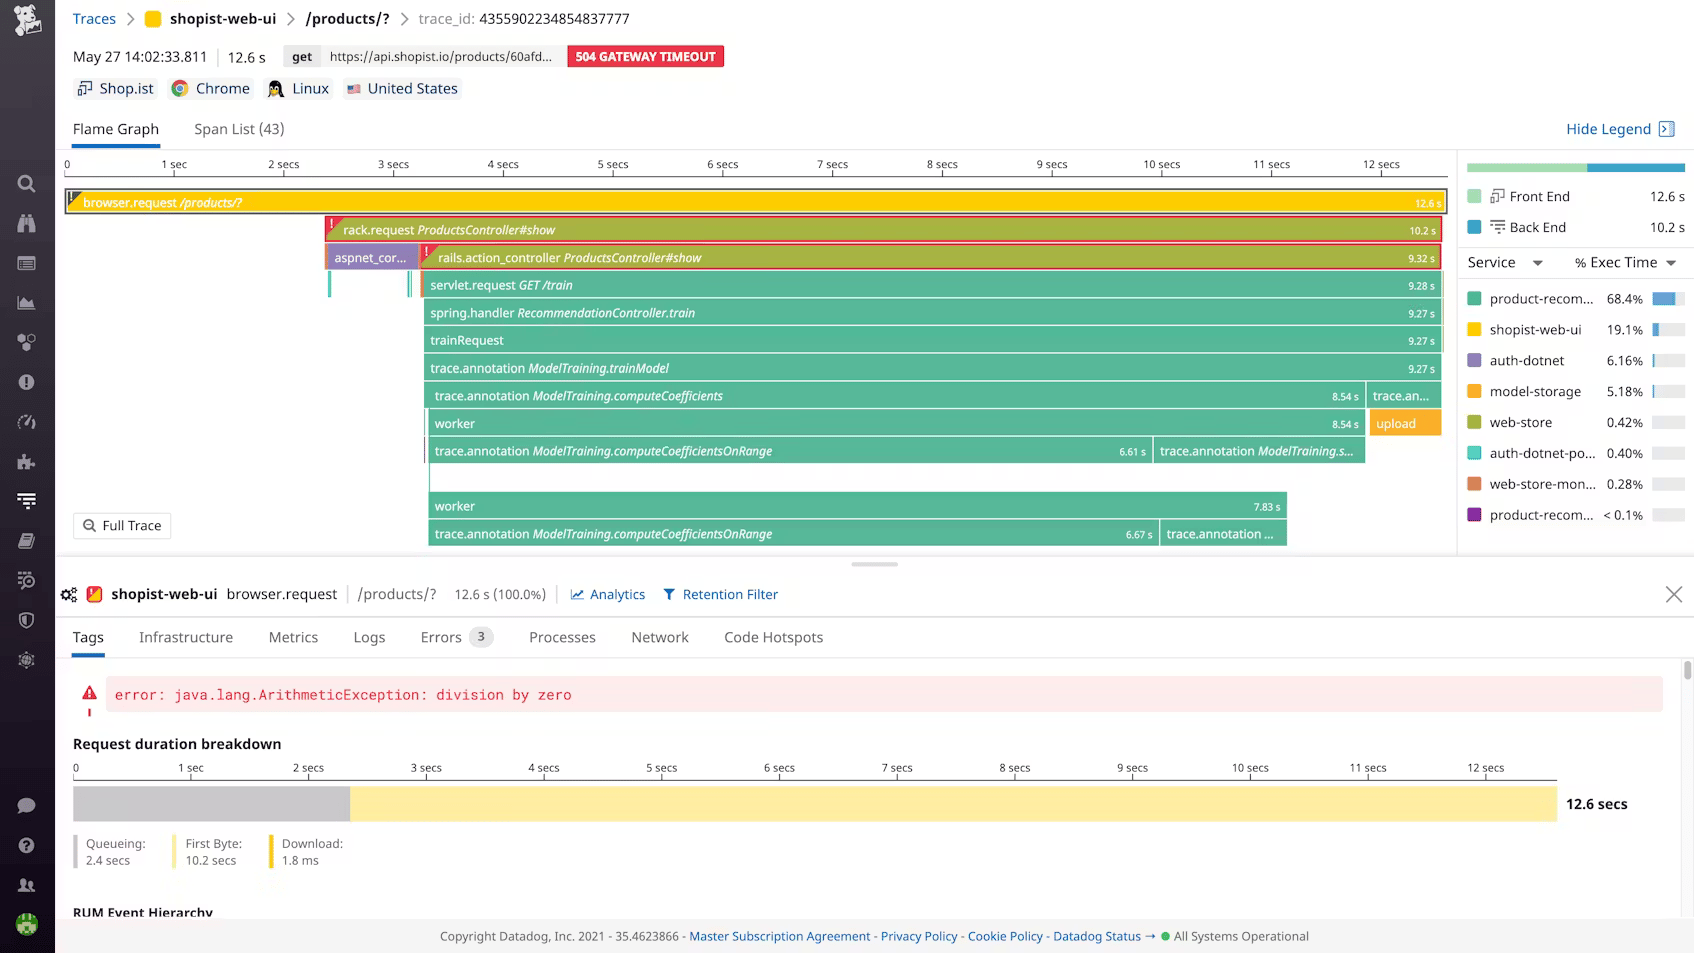
Datadog APM is one of the most feature-complete distributed tracing products available today. Service maps visualize dependencies across your entire stack. The Trace Explorer supports filtering by service, resource, latency, status code, and arbitrary tags. The Continuous Profiler captures code-level CPU and memory usage, letting you trace a slow request down to the specific function causing the problem. Dynamic Instrumentation lets you add log lines and metrics to running production services without redeploying.
The cost structure deserves attention. APM is billed at $31 to $40 per host per month, on top of the infrastructure fee, with 150 GB of ingested spans and 1 million indexed spans included per host per month. High-throughput microservices routinely exceed those limits. And if you use OpenTelemetry instrumentation, Datadog charges those metrics as custom metrics, penalizing you for following the open standard.
### groundcover: eBPF APM with data residency and Kubernetes-first service maps

groundcover's APM uses the same kernel-level capture approach as Better Stack. The eBPF sensor runs as a DaemonSet on Kubernetes nodes and traces application traffic, database queries, and service-to-service calls automatically. OpenTelemetry is supported natively alongside the eBPF capture, and neither source incurs a custom metric surcharge.
The service map builds automatically from kernel-level data, visualizing live service dependencies with network flow data that Datadog's APM can only approximate from agent-instrumented spans. Third-party API monitoring tracks external dependencies without any SDK configuration. The Traces Explorer supports multiple views with a simple query builder.
What groundcover's APM does not have: Datadog's code-level Continuous Profiler and Dynamic Instrumentation. Both are specialized capabilities for deep performance investigation that eBPF-based capture cannot match at line-level resolution.
The data residency angle matters for compliance-driven teams. Full request and response payloads, including potentially sensitive content, are captured by the eBPF sensor and stored entirely in your VPC. No production trace data touches groundcover's infrastructure.
| APM / tracing | Datadog | groundcover |
|---|---|---|
| Instrumentation | Proprietary SDK per service | eBPF (zero code changes) |
| OTel support | Yes (custom metric surcharge applies) | Yes (first-class, no surcharge) |
| Service map | Yes (agent-derived) | Yes (kernel-level network data) |
| Continuous profiling | Yes | No |
| Dynamic instrumentation | Yes | No |
| Data storage | Datadog-hosted | Your VPC |
| Environment coverage | Kubernetes, VMs, serverless, bare metal | Kubernetes-first, Linux hosts |
| APM pricing | $31–$40/host/month (on top of infra) | Included in per-node license |
[summary]
### APM without the per-host bill
Both Datadog and groundcover charge for APM, one per host on top of infrastructure fees. Better Stack's tracing is priced by data volume with no span indexing fees, no per-host charges, and no cardinality penalties, and the AI SRE activates automatically during incidents to investigate root cause before you have to ask.
**Full-fidelity distributed tracing from every service, priced by volume with no surprises.** [Explore Better Stack tracing.](https://betterstack.com/tracing)
[/summary]
---
## Log management
Log billing is where the gap between these platforms shows up most clearly in practice, and where the choice of pricing model matters most.
### Datadog: two-tier billing where the indexing cost is the real surprise
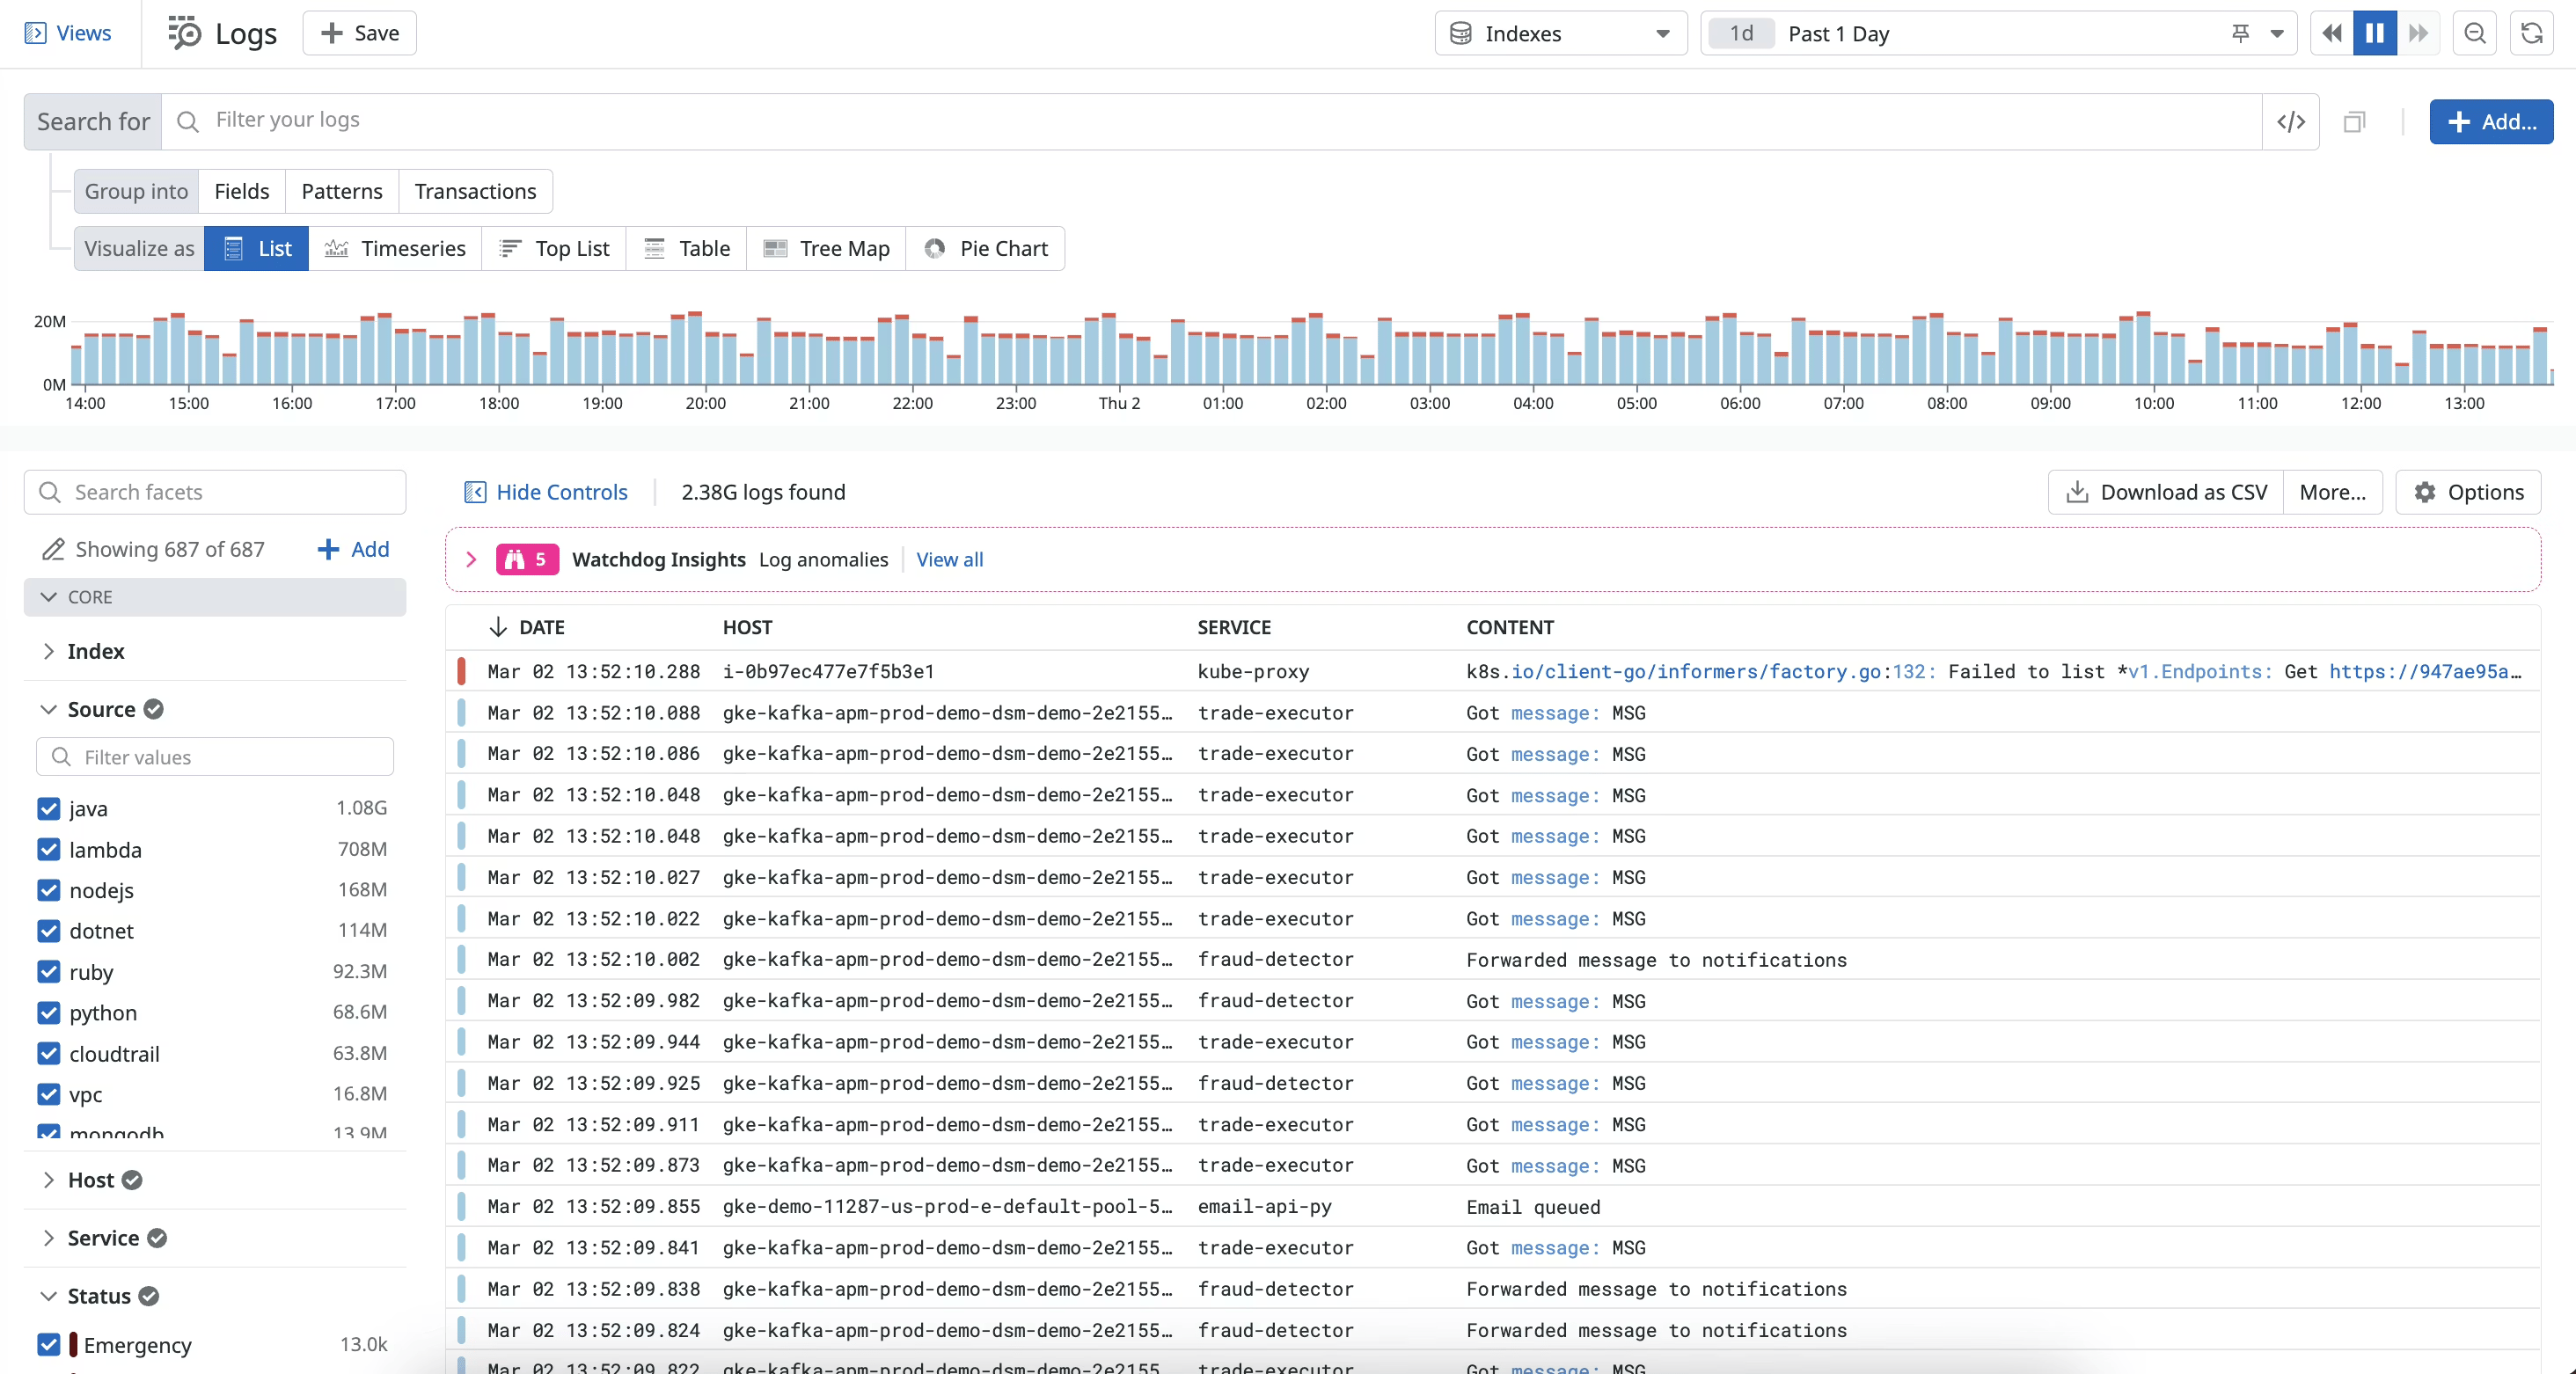
Datadog log management uses a two-tier billing model. You pay $0.10/GB for ingestion, which covers every byte you send whether you search it or not. Then you pay $1.70 per million log events to index them, which is what makes them actually searchable. Most teams end up ingesting everything but indexing selectively to control costs. The query experience is strong: faceted search, Log Patterns clustering, Sensitive Data Scanner for PII redaction, and seamless correlation to traces and host metrics.
The honest limitation is cost at scale. If you are running 100 GB of log volume per day, the Datadog log bill alone approaches $107,000 per year before APM, RUM, or anything else.
### groundcover: volume-agnostic log pricing inside your VPC

groundcover's logging pitch is simple: the volume of logs, metrics, traces, and other observability data does not affect your license cost. You pay per monitored node. If a node emits 1 GB or 100 GB per month, the license cost is identical. The tradeoff is that your VPC hosting bill does change with volume, because you are running ClickHouse in your cloud and paying your cloud provider for storage.
Log pipelines support OTTL-style processing, enrichment, and cross-linking between logs, traces, and Kubernetes objects for faster root cause analysis. Queries run through an embedded Grafana interface with support for log patterns for deduplicating repetitive messages. Log-to-trace correlation works automatically because both live in the same ClickHouse backend.
The node-based pricing model becomes most attractive for high-volume, Kubernetes-native log workloads. If you are generating 10 TB/month of logs from 200 nodes, groundcover's flat per-node model is genuinely compelling. You pay the storage bill to your cloud provider directly, with no SaaS markup on data volume.
| Log management | Datadog | groundcover |
|---|---|---|
| Billing model | $0.10/GB ingestion + $1.70/million events indexed | Per-node (data volume agnostic license) |
| Effective cost at high volume | ~$2.50–$3.00/GB (ingestion + indexing) | BYOC storage costs only (no license surcharge) |
| All logs searchable | 10–20% (rest archived) | Yes |
| Query language | Proprietary Log Search | SQL + PromQL via embedded Grafana |
| Data location | Datadog-hosted | Your VPC |
| Log-to-trace correlation | Yes | Yes |
| PII redaction | Yes (Sensitive Data Scanner) | Configurable at sensor level |
[summary]
### Log search with no indexing tax
Both Datadog and groundcover have pricing structures that can produce surprises at scale. Better Stack stores logs in a unified warehouse with SQL querying, no separate indexing layer, and no per-event charges. You pay for what you send, and all of it is searchable.
**Unified log management with SQL search, live tail, and no indexing surprises.** [See how it works.](https://betterstack.com/logs)
[/summary]
---
## Infrastructure monitoring and cloud metrics
Both platforms avoid the cardinality explosion billing that makes Datadog's custom metrics so painful for OpenTelemetry adopters. But they still differ significantly in environment scope, pricing shape, and what is included by default.
### Datadog: comprehensive fleet visibility built on a per-host foundation

Datadog infrastructure monitoring is billed at $15/host/month on Pro (annual) or $23/host/month on Enterprise. Host maps visualize your entire fleet. Kubernetes monitoring covers cluster state, node health, pod metrics, and autoscaling events in depth. Network Performance Monitoring tracks traffic between services, across availability zones, and through load balancers, a feature groundcover does not offer natively. Cloud Cost Management ties spending to infrastructure metrics for FinOps work. The high-water mark billing model means a five-day traffic spike can set your bill for the entire month at peak host count.
### groundcover: VictoriaMetrics-backed metrics with Kubernetes enrichment and no cardinality penalties

groundcover uses VictoriaMetrics for time-series storage, deployed in your VPC. It is Prometheus-compatible, supports PromQL natively, and handles high-cardinality workloads well because you are not paying per unique time series. The eBPF sensor auto-generates infrastructure metrics from kernel-level data: CPU, memory, disk, and network per workload, all enriched with Kubernetes metadata.
The Kubernetes monitoring is particularly thorough. Dedicated views exist for Pods, Nodes, Namespaces, Clusters, Deployments, Jobs, DaemonSets, StatefulSets, and Volumes, each with Metrics, Logs, Traces, and Events tabs so you can drill from a cluster overview into a specific pod and jump to its traces or logs without leaving the interface. Cloud monitoring integrations cover AWS (EC2, ECS, EKS, Lambda, RDS, ELB, VPC), Azure (VM, App Service, AKS), and GCP (Compute Engine, GKE, Cloud Run) with pre-built dashboards.
What groundcover lacks compared to Datadog: network performance monitoring as a dedicated product, host maps, and cloud cost management. And because Kubernetes is the platform's center of gravity, teams running significant workloads on VMs or serverless environments will feel the K8s-first orientation throughout.
| Infrastructure monitoring | Datadog | groundcover |
|---|---|---|
| Base pricing model | Per-host ($15–$23/month) | Per-node (included in license) |
| High-water mark billing | Yes (peak-of-99% monthly) | No (monthly average) |
| Kubernetes monitoring | Yes | Yes (primary strength) |
| Network performance monitoring | Yes | Limited |
| Cloud cost management | Yes | No |
| Cardinality penalties | Yes (custom metrics) | No |
| Data location | Datadog-hosted | Your VPC |
[summary]
### Infrastructure metrics that connect to the full reliability workflow
Both Datadog and groundcover charge for infrastructure telemetry in different ways. Better Stack takes a different approach: no per-host fees, no cardinality penalties, and infra metrics that live alongside uptime monitors, on-call schedules, and incident timelines.
**Infrastructure monitoring connected to alerting, on-call, and incident management, all in one place.** [Get started free.](https://betterstack.com)
[/summary]
---
## Digital experience monitoring
Both platforms have expanded their digital experience coverage significantly in 2025 and 2026. groundcover now ships RUM and session replay as GA features, which changes this comparison meaningfully from a year ago.
### Datadog: mature digital experience suite with seamless backend correlation

Datadog's Digital Experience suite is mature and comprehensive: Browser RUM, Mobile RUM (iOS, Android, React Native, Flutter), Session Replay, Synthetic Monitoring, Product Analytics, and Experiments. Session Replay lets you watch exactly how a user experienced a bug. Synthetic Monitoring runs scripted browser tests and API checks from Datadog's global probe network. The frontend-to-backend correlation is seamless because RUM and APM share the same backend. The full suite requires purchasing RUM, Session Replay, and Synthetic Monitoring as separate line items, which compounds the cost quickly.
### groundcover: BYOC RUM and session replay with backend correlation

groundcover's RUM now includes session replay, Core Web Vitals (LCP, CLS, INP), user journey analytics, and native integration with backend traces captured by the eBPF sensor. When a user triggers an API call, you see the complete distributed trace from browser to backend in one view. The BYOC advantage for RUM is real: RUM data is rich with user details, page URLs, behavior patterns, and potentially form inputs. With groundcover, that data never leaves your infrastructure.
Synthetic Monitoring is also now GA in groundcover, allowing proactive testing alongside real-user monitoring. What groundcover's RUM does not cover: mobile (iOS, Android), which Datadog supports natively across React Native and Flutter. RUM pricing is folded into the per-node license, meaning you do not pay per session.
| Digital experience | Datadog | groundcover |
|---|---|---|
| Browser RUM | Yes | Yes (GA) |
| Mobile RUM | Yes (iOS, Android, React Native, Flutter) | No |
| Session replay | Yes | Yes (GA) |
| Synthetic monitoring | Yes | Yes (GA) |
| Core Web Vitals | Yes | Yes |
| Product analytics | Yes | Yes |
| Frontend-to-backend correlation | Seamless (single backend) | Via eBPF trace correlation |
| Data location | Datadog-hosted | Your VPC |
| RUM pricing | Per session (separate SKU) | Included in per-node license |
---
## AI capabilities
Both platforms shipped production AI products in 2025 and 2026. The approach to where AI inference runs is the distinguishing factor.
### Datadog Bits AI: autonomous investigation that fires at alert time

Datadog launched Bits AI SRE in December 2025 as its first generally available autonomous AI agent. When an alert fires, Bits AI SRE starts investigating immediately without waiting for anyone to prompt it. By the time you reach your laptop, it has typically identified a likely root cause and in some cases proposed a code fix. Beyond Bits AI SRE, Datadog has Bits Chat for conversational observability queries, Bits Code for in-editor assistance, Bits Agent Builder for custom AI workflows, Bits Security Analyst for SIEM triage, and an MCP Server (currently in Preview) for connecting Claude, Cursor, and other AI clients to Datadog data.
The limitation worth knowing: all of this AI inference happens on Datadog's infrastructure. Your logs, traces, and metrics leave your environment to be processed by Datadog's AI systems. For compliance-sensitive teams, that is a meaningful data governance concern.
### groundcover Agent Mode and AI Mode: AI inference stays inside your cloud

groundcover launched Agent Mode (previously AI Mode) as generally available in March 2026 at KubeCon Amsterdam. Agent Mode runs natively within the customer's own AWS infrastructure via Amazon Bedrock, meaning logs, traces, and production telemetry never leave the customer's environment. Customers pay Amazon Bedrock token costs directly with no groundcover markup and can set usage limits by user or team.
Agent Mode is context-aware of where you are in the product and what you are looking at. It creates first-class groundcover assets from its output: dashboards, monitors, GCQL queries, and OTTL pipelines, all living in the same environment you were already working in. Agent Mode expanded to support Google Vertex AI in April 2026, extending the BYOC AI architecture to GCP customers. Cursor integration is available for moving directly from a production issue to an automated pull request without switching tools.
groundcover also announced that AI Mode can answer questions that are structurally impossible with instrumentation-dependent approaches, because the eBPF sensor captures telemetry even for services that were never manually instrumented with OpenTelemetry.
The honest comparison: Datadog's Bits AI SRE is more autonomous, activating unprompted when an alert fires. groundcover's Agent Mode is primarily developer-driven, with you initiating the investigation and Agent Mode using full kernel-level context to respond. Both are production-ready. The choice is whether autonomous proactive AI or compliance-preserving in-cloud AI matters more to your team.
| AI capability | Datadog | groundcover |
|---|---|---|
| Autonomous AI investigation (no prompting) | Yes (Bits AI SRE, GA Dec 2025) | Agent Mode (prompt-driven) |
| In-product AI assistant | Yes (Bits Chat) | Yes (Agent Mode, GA March 2026) |
| MCP server | Yes (Bits MCP Server, Preview) | Yes (active development) |
| AI inference location | Datadog cloud (external) | Your AWS/GCP environment (Bedrock/Vertex AI) |
| AI coding integration | Claude, Cursor, etc. | Cursor (direct PR workflow) |
| Compliance-preserving AI | No (data leaves your environment) | Yes (AI runs in your VPC) |
| Security AI analyst | Yes (Bits Security Analyst) | No |
[summary]
### AI that also wakes someone up
Both Datadog and groundcover have AI investigation features. What neither one includes is a direct path from an AI-generated root cause hypothesis to an on-call notification, an incident timeline, and a customer-facing status page update. Better Stack's AI SRE connects to the full incident lifecycle so the investigation and the response happen in the same place.
**Autonomous root cause investigation connected to on-call, incidents, and status pages.** [See the AI SRE.](https://betterstack.com)
[/summary]
---
## LLM observability
This is a category where groundcover has moved distinctly ahead, and it is worth acknowledging directly.
### groundcover: eBPF-based LLM observability with zero instrumentation and full payload capture

groundcover launched LLM observability in August 2025 and expanded agentic AI support in April 2026. The eBPF sensor captures full LLM interactions, including prompts, responses, token usage, latency, throughput, and error patterns, with no instrumentation required. Out-of-the-box support covers OpenAI, Anthropic, and Amazon Bedrock from sensor version 1.9.563, with data automatically structured into OTel GenAI Semantic Convention-compliant spans.
Because LLM payloads often contain sensitive data including PII and secrets, groundcover supports configurable field obfuscation while keeping metadata like model and token counts visible. The BYOC architecture means prompt content never leaves your cloud, which matters for teams running compliance-sensitive LLM workloads.
### Datadog: Agent Observability for LLM monitoring via SDK instrumentation

Datadog covers AI and LLM observability through its Agent Observability product, with GPU Monitoring available separately. LLM monitoring requires SDK instrumentation via OpenTelemetry or Datadog's own libraries, which means uninstrumented services are invisible. For teams that have manually instrumented their LLM calls, Datadog's dashboard and alerting experience is solid.
The gap is zero-instrumentation capture: groundcover can observe LLM API calls from services that were never touched by a developer, because the eBPF sensor works at the network level. Datadog cannot. If you have third-party services making LLM calls that you do not control, groundcover gives you visibility that Datadog cannot match.
| LLM observability | Datadog | groundcover |
|---|---|---|
| Dedicated product | Yes (Agent Observability) | Yes (GA since August 2025) |
| Zero-instrumentation capture | No | Yes (eBPF) |
| Full payload visibility | Via OTel SDK instrumentation | Yes (eBPF, all services) |
| OpenAI, Anthropic, Bedrock | Via OTel SDKs | Native eBPF auto-detection |
| Agentic AI workflow tracing | Yes | Yes (GA April 2026, Vertex AI support) |
| PII obfuscation | Via OTel processors | Native configuration |
| Data location | Datadog-hosted | Your VPC |
---
## Incident management and alerting
This is a category where the platforms diverge sharply, and the gap has real cost implications.
### Datadog: seat-based incident management that leans on external paging tools

Datadog's incident management is a seat-based SKU. You declare incidents from monitor alerts, security signals, or events. On-call scheduling is available through Datadog On-Call (launched late 2024) or integrations with PagerDuty and OpsGenie. Phone and SMS alert delivery requires those external tools.
### groundcover: alerting only, no incident management

groundcover provides monitors (threshold, anomaly, deployment-aware), issue auto-aggregation that groups repeating problems into de-duplicated issues, and workflows for routing alerts via Slack, PagerDuty, OpsGenie, MS Teams, and webhooks. Planned Maintenance lets you silence alerts during scheduled windows on one-time or recurring schedules.
What groundcover does not have: on-call rotations, phone/SMS delivery, escalation policies, incident channels, or post-mortem generation. The typical pattern is routing alerts to incident.io or PagerDuty. For a 5-responder team, that adds $100 to $400/month on top of the groundcover license.
| Incident management | Datadog | groundcover |
|---|---|---|
| On-call scheduling | Via Datadog On-Call or external | Not included |
| Phone/SMS delivery | Via PagerDuty/OpsGenie | Via external tools |
| Escalation policies | Yes | Not included |
| Slack incident channels | Yes | Via external tools |
| Post-mortems | Yes | Via external tools |
| Alert routing | Yes | Yes (webhook, Slack, PagerDuty, OpsGenie) |
| Planned maintenance / alert silencing | Yes | Yes |
---
## Pricing comparison
The pricing models are structured so differently that a direct per-line-item comparison requires knowing your workload shape. The key variable is your ratio of data volume to node count.
### Datadog: multidimensional billing that compounds with every product you add

Datadog bills across several independent dimensions: per-host for infrastructure ($15 to $23/month) and APM ($31 to $40/month), per-GB for log ingestion ($0.10), per million events for log indexing ($1.70), and per metric for custom metrics beyond the per-host allotment. The high-water mark billing model means a five-day traffic spike sets your bill for the whole month at peak host count. Adding products like RUM, database monitoring, and security compounds the base charges.

For a 100-host deployment with APM, logs, and RUM, Datadog commonly runs $20,000 to $30,000 per month before any security or database monitoring products.
### groundcover: per-node with BYOC hosting costs on top
groundcover's pricing (from its April 2026 self-serve launch): Free tier ($0, 12-hour retention), Pro ($30/host/month, all integrations and features), Enterprise ($35/host/month, adds RBAC and unlimited retention), and On-Premise ($50/host/month, fully on-prem). Billing is based on monthly average host count rather than peak, which avoids Datadog's high-water mark billing problem.
**The hidden line item is BYOC hosting.** Because groundcover runs in your VPC, you pay your cloud provider for EC2, EBS, S3, and networking. groundcover's public TCO calculator shows:
| Scenario | Pro license | BYOC hosting | Annual total |
|---|---|---|---|
| 50 nodes | $18,000 | ~$3,500 | ~$21,500 |
| 450 nodes | $162,000 | ~$23,343 | ~$185,343 |
| 1,900 nodes | ~$684,000 | ~$95,000+ | ~$779,000+ |
**The model favors data-heavy, node-light workloads.** If you have 50 nodes generating 10 TB/month of logs, groundcover's flat per-node pricing is significantly cheaper than Datadog's ingestion-plus-indexing charges. If you have 500 nodes with modest per-node data volumes, the calculus is closer and sometimes favors Datadog.
**Scenario: 100 hosts, moderate data volume (2.5TB/month telemetry)**
| Cost component | Datadog (Pro, annual) | groundcover (Pro) |
|---|---|---|
| Infrastructure monitoring | $1,500/month | Included in per-node |
| APM | $3,100/month | Included in per-node |
| Log management | ~$3,600/month (ingestion + indexing) | BYOC storage only (~$300/month) |
| RUM / digital experience | Per-session, separate SKU | Included in per-node |
| Platform license | Included above | $3,000/month (100 nodes x $30) |
| BYOC hosting | None | ~$600/month |
| **Estimated monthly total** | **~$8,200+/month** | **~$3,900/month** |
This is a simplified estimate and real costs vary. The groundcover advantage compresses significantly at higher node counts or when BYOC hosting scales with data volume. Model your specific workload before committing.
| Pricing factor | Datadog | groundcover |
|---|---|---|
| Free tier | No | Yes (12-hour retention) |
| Per-host fee | Yes ($15–$23/month) | Per-node ($30–$50/month, all features included) |
| APM included | No (additional $31–$40/host) | Yes |
| Log ingestion billing | Yes ($0.10/GB) | No (BYOC storage only) |
| High-water mark billing | Yes | No (monthly average) |
| Custom metric surcharges | Yes | No |
| BYOC infrastructure overhead | None | Yes (your cloud provider bill) |
---
[summary]
### Enterprise observability without the multi-vendor model
Both Datadog and groundcover require separate tools for incident management, on-call scheduling, and status pages. Better Stack consolidates logs, metrics, traces, on-call scheduling, incident management, and status pages into one platform with one bill.
**Fewer vendors, fewer context switches, and a single place for the full reliability workflow.** [Talk to us.](https://betterstack.com)
[/summary]
---
## Security and compliance
### Datadog: Cloud SIEM and a full security platform woven into observability

Datadog has a substantial security platform: Cloud SIEM for threat detection across logs and cloud audit trails, Workload Protection for runtime kernel-level threat detection, App and API Protection against injection attacks, Code Security covering SAST/IAST/SCA/IaC scanning and secret scanning, Cloud Security Posture Management, and Vulnerability Management. The integration between security signals and observability data is Datadog's core differentiator here. A security alert and the application trace that triggered it live in the same system.
### groundcover: compliance through architecture, no security product
**groundcover has no security product**. No Cloud SIEM, no threat detection, no workload protection. What it has is a structural compliance advantage: because all telemetry data lives in your VPC, regulated teams automatically satisfy data residency requirements that SaaS platforms can only approximate with regional deployments. SOC 2 Type II and ISO 27001 certifications apply at the product level. HIPAA compliance follows from the BYOC architecture. The On-Premise tier extends to air-gapped environments for government, defense, and regulated industries that cannot use cloud SaaS at all.
| Security and compliance | Datadog | groundcover |
|---|---|---|
| Cloud SIEM | Yes | No |
| Workload protection (runtime) | Yes | No |
| Code security (SAST/IAST/SCA) | Yes | No |
| Cloud security posture management | Yes | No |
| SOC 2 Type II | Yes | Yes |
| ISO 27001 | Yes | Yes |
| HIPAA | Yes | Yes (BYOC data plane) |
| FedRAMP | Yes (GovCloud) | No |
| Data residency (self-hosted) | No | Yes (BYOC or on-prem) |
| Air-gapped deployment | No | Yes (On-Premise tier) |
---
## What each platform genuinely lacks
Being honest about gaps is how you avoid buyer's remorse.
**Datadog gaps worth knowing:**
- No free tier; evaluation requires a paid trial
- No self-hosted option; your telemetry data stays in Datadog's infrastructure permanently
- OpenTelemetry metrics treated as custom metrics, a significant cost penalty
- High-water mark billing can spike your bill from short traffic events
- No status pages
- Per-host pricing creates cost pressure that discourages broad instrumentation
**groundcover gaps worth knowing:**
- No Cloud SIEM, no threat detection, no security monitoring product
- Kubernetes-first orientation makes it awkward for mixed VM and serverless environments
- No built-in incident management, on-call scheduling, or phone/SMS delivery
- No status pages
- No mobile RUM (iOS, Android)
- BYOC provisioning takes hours and requires ongoing VPC resource management
- Agent Mode is prompt-driven rather than fully autonomous like Datadog's Bits AI SRE
- FedRAMP authorization not available
- BYOC hosting costs scale with data volume in ways that can surprise heavy log teams
---
## Final thoughts
Datadog and groundcover are built for different operating models, so the decision usually comes down to which tradeoffs matter most to your team rather than which platform is objectively better.
**Datadog is a better fit when** you want observability and security consolidated into a single platform, need support for FedRAMP-regulated environments, depend on capabilities like session replay and synthetic monitoring, or prefer a fully managed service without having to operate observability infrastructure yourself. It also tends to make sense for organizations with a broad mix of Kubernetes, VMs, and serverless workloads, especially if they've already standardized on Datadog and rely on the visibility that comes from correlating data across multiple Datadog products.
**groundcover is a stronger choice when** your telemetry data needs to stay within your own cloud environment, Kubernetes sits at the center of your infrastructure strategy, **when your log volume is high relative to your node count** and usage-based pricing becomes expensive, or when AI-powered observability is a key requirement. Its BYOC architecture, which allows AI inference to run through AWS Bedrock inside your own environment, is particularly appealing for teams with strict compliance, privacy, or data residency requirements.
Cost is often one of the biggest factors in the evaluation. For Kubernetes-heavy environments, groundcover can be substantially less expensive than Datadog, with savings commonly landing in the 40-60% range. However, those numbers vary by workload. At larger node counts, the pricing advantage can shrink, and teams using the BYOC deployment model should account for the additional cloud infrastructure costs that sit outside the platform subscription. The most accurate comparison comes from modelling your own telemetry volume, node count, and retention requirements before making a decision.
[summary]
### One thing neither covers: the full reliability layer
Neither Datadog nor groundcover includes uptime monitoring, on-call scheduling with phone and SMS, incident management, and customer-facing status pages as a unified product. Better Stack brings all of that together with logs, metrics, and traces, with usage-based pricing and no per-host fees.
**The full reliability lifecycle in one place. Start free, no credit card required.** [Try Better Stack.](https://betterstack.com)
[/summary]