# Datadog vs Grafana Cloud: A Complete Comparison for 2026
If you are evaluating observability platforms right now, you have almost certainly landed on Datadog and Grafana Cloud as the two names everyone keeps mentioning. They both cover the core telemetry stack, they both have enterprise customers running production workloads at scale, and they both have strong ecosystems. But they represent genuinely different philosophies about what an observability platform should be.
**Datadog is the integrated SaaS platform.** You install one agent, data flows into one system, and everything works together from day one. The tradeoff is cost: per-host pricing, per-feature pricing, and billing dimensions that compound in ways that catch most teams off guard after the first invoice.
**Grafana Cloud is the managed open-source stack.** It takes the LGTM stack you may already know (Loki for logs, Grafana for visualization, Tempo for traces, Mimir for metrics) and runs it as a managed service. You get open standards, no vendor lock-in on your data formats, and pricing that is generally more predictable at scale. The tradeoff is configuration overhead and a steeper learning curve across three different query languages.
Neither is right for every team. **Datadog has things Grafana Cloud simply has not built:** a proprietary autonomous AI SRE, Cloud SIEM, network performance monitoring, and a single-pane investigation flow that does not require switching between query languages. Grafana Cloud has things Datadog cannot offer: a genuine free tier, open-source backends you can self-host, open query standards with no vendor lock-in, and a plugin ecosystem that connects to virtually any data source.
This article works through both tools across architecture, APM, log management, infrastructure metrics, AI, pricing, security, and enterprise readiness. The goal is enough specificity to support a real procurement decision.
## Quick comparison at a glance
| Feature | Datadog | Grafana Cloud |
|---|---|---|
| **Deployment model** | SaaS only | Managed cloud, self-hosted (OSS), enterprise BYOC |
| **Open source** | No | Yes (Grafana, Loki, Mimir, Tempo all OSS) |
| **Free tier** | No | Yes (10K metrics, 50GB logs, 50GB traces/month) |
| **Starting price** | $15/host/month (infra only) | $29/month (Pro plan, usage-based) |
| **Pricing model** | Per-host + per-feature + per-GB + per-million events | Per-series + per-GB + per-host-hour (by product) |
| **Custom metric surcharges** | Yes ($1/100 beyond allotment) | No (pay per active series, no surcharge concept) |
| **OTel-native** | Partial (prefers DD Agent) | Yes (Alloy is OTel Collector-based, first-class) |
| **APM / distributed tracing** | Yes (proprietary + OTel) | Yes (Tempo + Application Observability, OTel-native) |
| **Log management** | Yes (two-tier: ingestion + indexing) | Yes (Loki, LogQL) |
| **Infrastructure metrics** | Yes (per-host) | Yes (Mimir, per-series) |
| **Cloud monitoring (AWS/Azure/GCP)** | Yes (750+ integrations) | Yes (700+ integrations via Alloy + plugins) |
| **Kubernetes monitoring** | Yes | Yes (Kubernetes Monitoring product) |
| **Visualization / dashboards** | Yes (good) | Yes (best-in-class) |
| **Real user monitoring** | Yes (browser + mobile) | Yes (Frontend Observability) |
| **Session replay** | Yes | Via third-party integration |
| **Synthetic monitoring** | Yes | Yes (Grafana Cloud Synthetic Monitoring) |
| **Continuous profiling** | Yes | Yes (Pyroscope) |
| **Performance testing** | No | Yes (Grafana k6) |
| **Incident management** | Yes (seat-based add-on) | Yes (Grafana IRM, $20/active user/month) |
| **Status pages** | No | No |
| **On-call scheduling** | No (integrates with PagerDuty/OpsGenie) | Yes (via Grafana IRM) |
| **AI SRE (autonomous)** | Yes (Bits AI SRE, GA Dec 2025) | Grafana Assistant Investigations |
| **MCP server** | Yes (Bits MCP Server, Preview) | Yes (Grafana Cloud MCP server, GA) |
| **Cloud SIEM / security** | Yes (extensive) | No |
| **Network monitoring** | Yes | Limited |
| **SOC 2 Type II** | Yes | Yes |
| **HIPAA** | Yes | Yes (Enterprise) |
| **FedRAMP** | Yes (GovCloud) | Yes (Federal Cloud, Enterprise) |
| **Data residency / self-hosted** | No | Yes (BYOC Enterprise, full OSS self-hosted) |
| **Vendor lock-in risk** | High (proprietary agent + data format) | Low (open query languages, open backends) |
---
## Platform architecture and philosophy
The architectural difference between these two tools is not just about technology. It reflects genuinely different opinions about where control should sit and what the relationship between your team and your observability vendor should look like.
### Datadog: one agent, one system, one proprietary backend

Datadog is built on a proprietary agent and a proprietary data model. You install the Datadog Agent on every host, and it collects metrics, logs, and traces and ships them to Datadog's hosted infrastructure. The integration is tight by design: data from a Kubernetes pod, a database query, a browser session, a CI pipeline run, and a security alert all land in one system. Correlating across those signal types is seamless because Datadog controls the entire pipeline from collection to storage to query.
The tradeoff is lock-in. Your data lives in Datadog's systems in Datadog's format. Your dashboards are built in Datadog's query language. Your alerting logic is in Datadog's system. If you decide to leave, you are looking at re-instrumenting everything. And if you use OpenTelemetry, Datadog supports it but treats OTel metrics as custom metrics, which means you pay extra for following the open standard.
### Grafana Cloud: open backends, open query standards, composable by design

Grafana Cloud is built on the LGTM stack: Loki for logs, Grafana for visualization, Tempo for traces, and Mimir for metrics. All four backends are open-source projects you could self-host tomorrow if you wanted to. Grafana Alloy, the data collection layer, is based directly on the OpenTelemetry Collector and supports any OTel-compatible source, hundreds of Prometheus exporters, and direct integrations with major cloud providers.
The composability is Grafana Cloud's defining characteristic. You can replace any layer. You can export your data. The query languages (LogQL, PromQL, TraceQL) are open standards. If you leave Grafana Cloud, your Grafana dashboards still work, your Prometheus exporters still work, and your OTel instrumentation still works. You just point them elsewhere.
The tradeoff is that you are navigating three different query languages depending on what you are investigating, and correlating across signal types requires more deliberate dashboard construction rather than the automatic correlation Datadog provides.
| Architectural factor | Datadog | Grafana Cloud |
|---|---|---|
| Data collection | Proprietary DD Agent (OTel supported but secondary) | Grafana Alloy (OTel Collector-based, first-class) |
| Storage | Proprietary hosted backend | Open-source backends (Loki, Mimir, Tempo) |
| Query language | Proprietary (DQL) + some PromQL | LogQL (logs), PromQL (metrics), TraceQL (traces) |
| Vendor lock-in risk | High | Low (open standards throughout) |
| Self-hosted option | No | Yes (full OSS stack) |
| Free tier | No | Yes (10K metrics, 50GB logs, 50GB traces/month) |
| Plugin ecosystem | 750+ integrations | 700+ integrations + Grafana plugin library |
| OTel metric surcharges | Yes (treated as custom metrics) | No |
[summary]
### Neither Datadog nor Grafana Cloud covers the full reliability picture
Both platforms focus on telemetry. Neither includes built-in uptime monitoring, on-call scheduling with phone and SMS delivery, or customer-facing status pages as part of the core product. Better Stack brings all of that together in one place alongside logs, metrics, and traces, so you can go from alert to post-mortem without switching tools.
**From heartbeat monitoring to incident timelines to status pages, one platform for the whole reliability lifecycle.** [Start free.](https://betterstack.com)
[/summary]
---
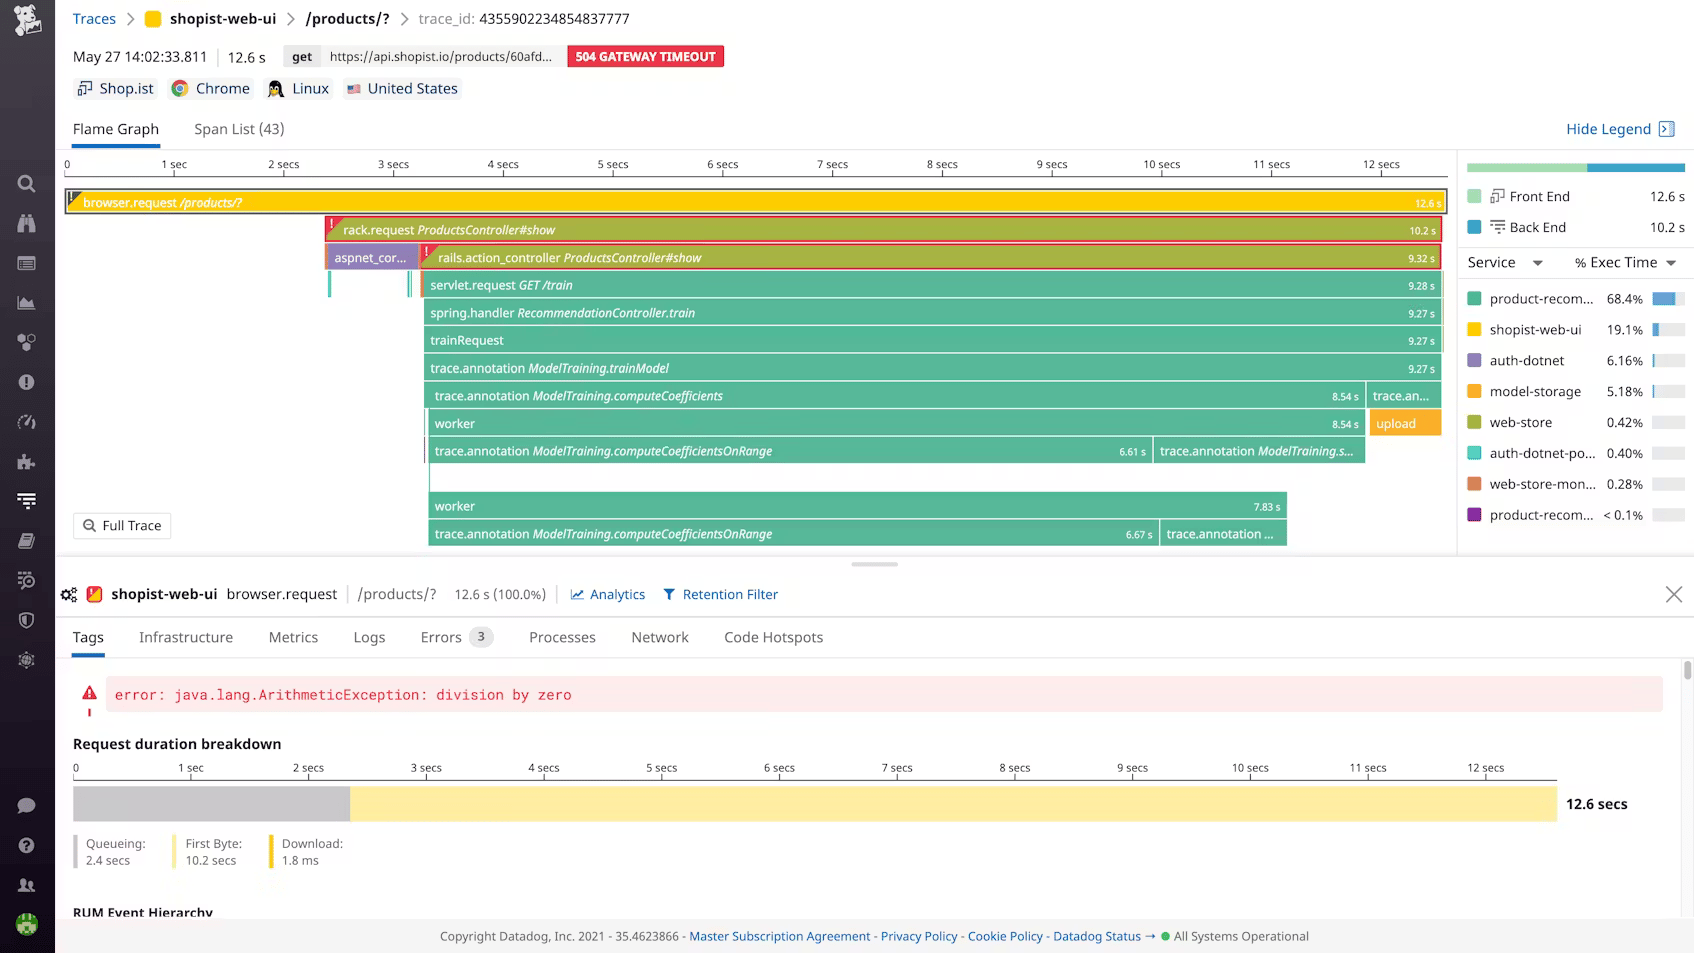
## APM and distributed tracing
APM is where the instrumentation philosophy difference between these platforms shows up most concretely. Both tools can tell you where a slow request came from. How they get that data, and what you pay for it, are very different stories.
### Datadog: agent-based APM with deep profiling and a per-host bill
Datadog APM requires installing language-specific tracing libraries in each service: `ddtrace` for Python, `dd-trace-go` for Go, `dd-trace-java` for Java. Each service gets its own SDK installation, environment variable configuration, and sampling rate tuning to control span indexing costs. The upside is depth: Datadog's APM is one of the most feature-complete on the market, with service maps, Continuous Profiler for code-level CPU attribution, Dynamic Instrumentation for adding log lines to production without redeploying, and Watchdog for automatic anomaly detection. The cross-signal correlation is seamless, because Datadog controls all three backends.
The cost structure deserves attention. APM is billed at $31 to $40 per host per month, on top of the infrastructure fee, with 150 GB of ingested spans and 1 million indexed spans included per host per month. High-throughput microservices routinely exceed those limits. And if you use OpenTelemetry instrumentation, Datadog charges those metrics as custom metrics, penalizing you for following the open standard.
### Grafana Cloud: OTel-native APM at roughly half the per-host cost

Grafana Cloud's APM has two layers. The first is Grafana Tempo, the managed trace storage backend, which accepts any OTel-compatible trace data and supports TraceQL for sophisticated trace querying. The second is Application Observability, a curated product layer on top of Tempo that provides pre-built service dashboards, RED metrics automatically derived from trace data, and one-click navigation between traces, logs, and infrastructure metrics.
Application Observability is OpenTelemetry-native and genuinely well-designed. The service map builds automatically from OTel trace data. The RED metrics are computed from spans without requiring separate instrumentation. Trace-to-log and trace-to-metrics correlation works through Grafana Explore, though it requires navigating panels rather than the seamless click-through Datadog offers.
The cost difference is meaningful: Application Observability costs roughly $18/host/month on the Pro tier versus Datadog's $31 to $40/host/month. Grafana Cloud also includes Pyroscope for continuous profiling, which Datadog charges separately for. And Grafana Beyla, Grafana Labs' eBPF-based zero-code instrumentation tool, was donated to the OpenTelemetry project in 2025 and is available as a complementary option for teams who want automatic instrumentation on Kubernetes without SDK setup.
| APM / tracing | Datadog | Grafana Cloud |
|---|---|---|
| Instrumentation model | Proprietary SDK per service | OTel SDK per service (Alloy-based) |
| OTel-native | Partial (OTel = custom metrics surcharge) | Yes (first-class, no surcharge) |
| Trace storage | Proprietary | Grafana Tempo (open-source) |
| Service map | Yes (automatic) | Yes (automatic via OTel) |
| RED metrics | Yes (automatic) | Yes (Application Observability) |
| Continuous profiling | Yes (Continuous Profiler) | Yes (Pyroscope) |
| Dynamic instrumentation | Yes | No |
| TraceQL / advanced query | Proprietary DQL | TraceQL (purpose-built, open) |
| APM pricing | $31–$40/host/month (on top of infra) | ~$18/host/month (Application Observability) |
| Cross-signal correlation | Seamless (single backend) | Via Grafana Explore navigation |
[summary]
### APM without the per-host bill
Both Datadog and Grafana Cloud charge per host for APM on top of base infrastructure costs. Better Stack's tracing is priced by data volume with no span indexing fees, no per-host charges, and no cardinality penalties, and the AI SRE activates automatically during incidents to investigate root cause before you have to ask.
**Full-fidelity distributed tracing from every service, priced by volume with no surprises.** [Explore Better Stack tracing.](https://betterstack.com/tracing)
[/summary]
---
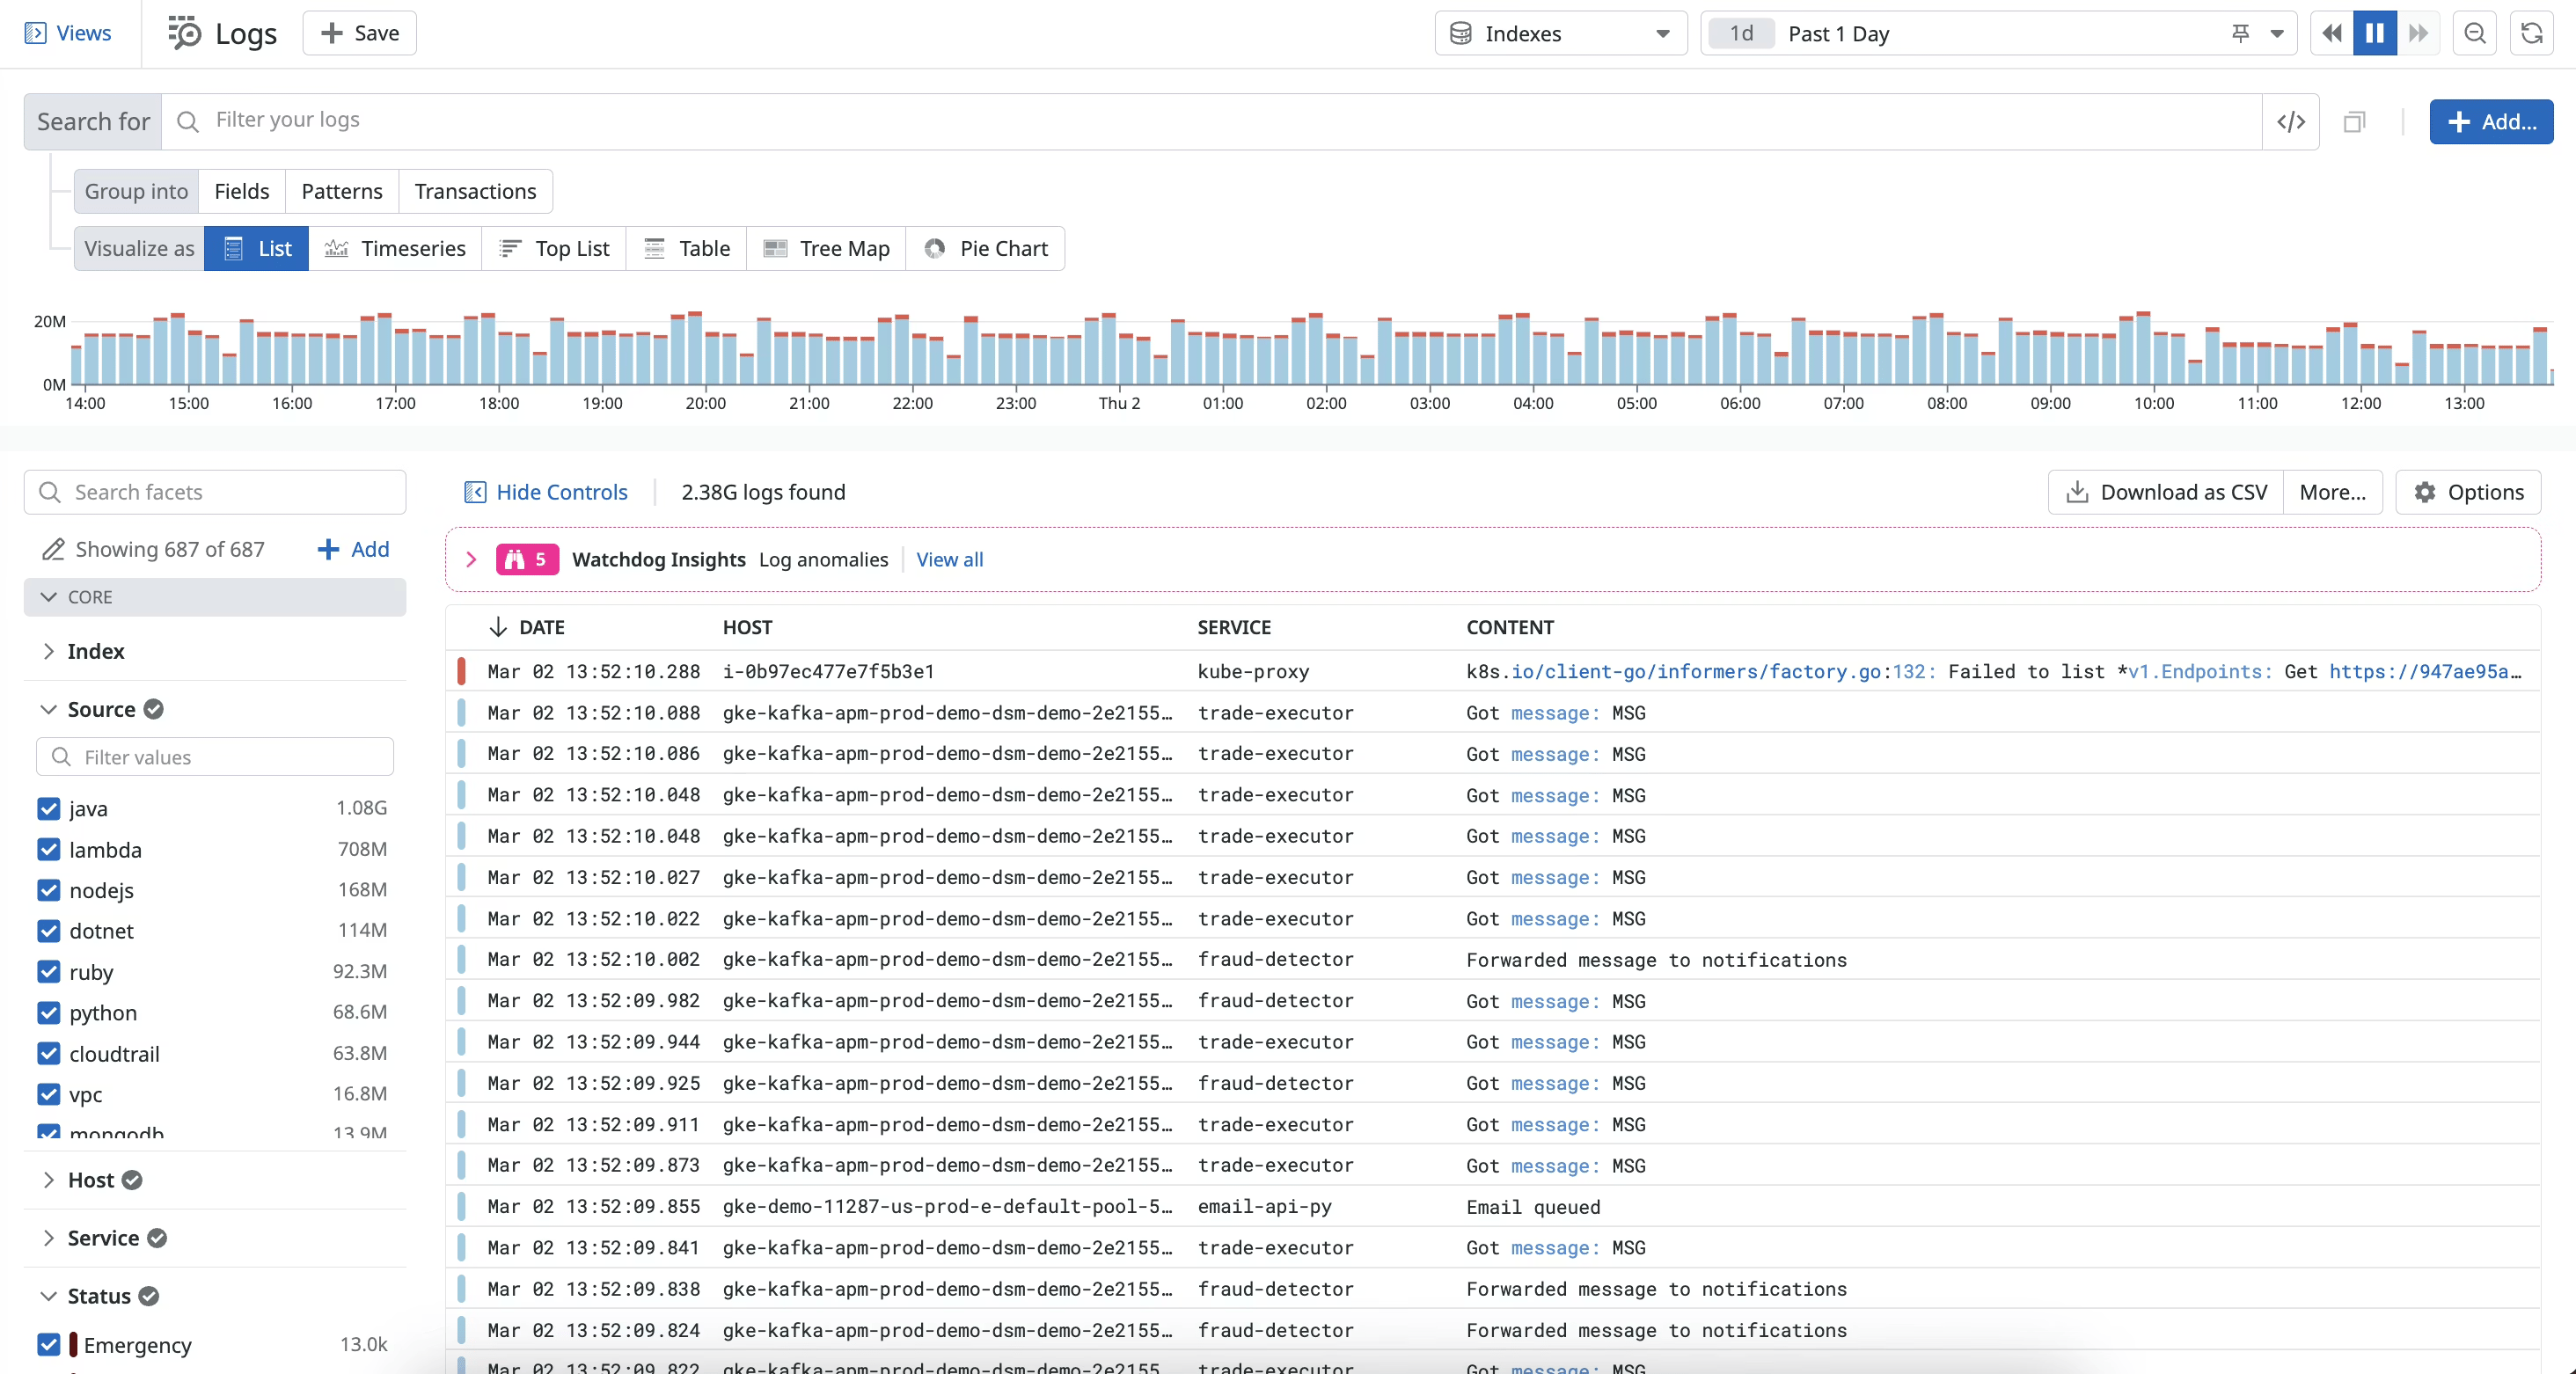
## Log management
Log billing is where the gap between these two platforms becomes most visible in practice. The headline per-GB rates look similar until you account for what actually makes logs searchable.
### Datadog: two-tier billing where indexing is where the real cost hides
Datadog log management uses a two-tier billing model. You pay $0.10/GB for ingestion, which covers every byte you send whether you search it or not. Then you pay $1.70 per million log events to index them, which is what makes them actually searchable. Most teams end up ingesting everything but indexing selectively to control costs. Datadog's Observability Pipelines help route and filter logs before indexing, but they add configuration overhead.
The query experience is strong: faceted search, Log Patterns that cluster similar lines automatically, Sensitive Data Scanner for PII redaction, and seamless correlation to traces and host metrics. The honest limitation is what all of this costs at scale. If you are running 100 GB of log volume per day, the Datadog log bill alone approaches $107,000 per year before APM, RUM, or anything else.
### Grafana Cloud: Loki's label-based indexing keeps costs down, but LogQL takes getting used to

Grafana Cloud's Loki backend uses a label-based indexing model: only metadata is indexed, not log content. This is what makes Loki cost-effective at scale. The effective rate at the Pro tier is roughly $0.55/GB ingested (combining process, write, and retention charges). For workloads where you index most of what you ingest, the effective Datadog cost per GB lands between $2.50 and $3.00, significantly more than Loki.
The query language is LogQL, which is powerful and expressive but has a different learning curve from SQL or Datadog's proprietary search DSL. Adaptive Logs can automatically identify log patterns your queries never touch and reduce ingestion by up to 50%. The default retention on the Pro tier is 30 days. Because Loki is open-source, teams can self-host the entire log infrastructure if they outgrow the managed pricing, a genuine escape valve Datadog does not offer.
| Log management | Datadog | Grafana Cloud |
|---|---|---|
| Billing model | $0.10/GB ingestion + $1.70/million events indexed | ~$0.55/GB effective (process + write + retain) |
| Effective cost at scale | ~$2.50–$3.00/GB (ingestion + indexing) | ~$0.55/GB |
| Indexing model | Two-tier (indexed vs archived) | Label-based (all labeled logs searchable) |
| Query language | Proprietary Log Search | LogQL |
| Adaptive cost reduction | Observability Pipelines (routing only) | Adaptive Logs (up to 50% reduction) |
| Default retention | 15 days (indexed) | 30 days (Pro) |
| Self-hosted escape valve | No | Yes (Loki OSS) |
| Cross-signal correlation | Seamless (single backend) | Via Grafana Explore |
[summary]
### Log search with no indexing tax
Both Datadog and Grafana Cloud have pricing structures that produce surprises at scale. Better Stack stores logs in a unified warehouse with SQL querying, no separate indexing layer, and no per-event charges. You pay for what you send, and all of it is searchable.
**Unified log management with SQL search, live tail, and no indexing surprises.** [See how it works.](https://betterstack.com/logs)
[/summary]
---
## Infrastructure monitoring and cloud metrics
Neither platform charges for custom metric cardinality in the same punishing way Datadog does for OpenTelemetry metrics specifically. But they still differ significantly in how they structure costs, what is included by default, and how much operational leverage you get from the base tier.
### Datadog: comprehensive fleet visibility built on a per-host foundation that stacks fast

Datadog infrastructure monitoring is billed at $15/host/month on Pro (annual) or $23/host/month on Enterprise. It is the foundation charge on which everything else stacks: APM, database monitoring, and network monitoring all bill on top of it at the same host count. Host maps visualize your fleet at a glance. Kubernetes monitoring covers cluster state, node health, pod metrics, and autoscaling events. Network Performance Monitoring tracks traffic between services, across availability zones, and through load balancers, a feature Grafana Cloud does not offer natively. Cloud Cost Management ties spending to infrastructure metrics for FinOps work.
The billing model uses a high-water mark approach: Datadog meters host count hourly, drops the top 1% of hours, and bills the month at the 99th-percentile peak. A five-day traffic spike can set your bill for the entire month at peak host count. Most teams discover this the hard way.
### Grafana Cloud: per-series Mimir pricing with Adaptive Metrics as a genuine cost lever

Grafana Cloud's metrics backend is Mimir, billed at $6.50 per 1,000 active series/month. Adaptive Metrics can reduce your billable series count by up to 80% by automatically aggregating unused series. Full PromQL support means your existing Prometheus recording rules, alert expressions, and dashboards work without modification.
The Kubernetes Monitoring product ($7.20/host/month Pro) provides pre-built dashboards for cluster health, workload performance, and cost analysis. Database Observability ($51/database host/month Pro) adds deep query-level visibility for MySQL and PostgreSQL. Both are separately priced products rather than included in the base infrastructure tier, which creates a similar compounding pattern to Datadog, just at different price points.
Where Grafana Cloud has a concrete advantage is the plugin ecosystem. Over 700 integrations connect Grafana dashboards to virtually any monitoring system, database, cloud provider, or SaaS tool. Enterprise plugins add connections to Splunk, New Relic, Dynatrace, ServiceNow, and others. If you need to pull metrics from heterogeneous systems into one view, Grafana's data source flexibility is unmatched.
| Infrastructure monitoring | Datadog | Grafana Cloud |
|---|---|---|
| Base pricing model | Per-host ($15–$23/month) | Per-series ($6.50/1K series/month) |
| High-water mark billing | Yes (peak-of-99% monthly) | No |
| Kubernetes monitoring | Yes (included) | Kubernetes Monitoring product ($7.20/host/month) |
| Network performance monitoring | Yes | Limited (no dedicated NPM product) |
| Continuous profiling | Yes (Continuous Profiler) | Yes (Pyroscope, $0.05/GB process) |
| Cost reduction tools | None | Adaptive Metrics (up to 80% reduction) |
| Plugin / data source breadth | 750+ integrations | 700+ (largest open plugin ecosystem) |
| PromQL support | Yes | Full support (native) |
| Self-hosted escape valve | No | Yes (Mimir + Prometheus OSS) |
[summary]
### Infrastructure metrics that connect to the full reliability workflow
Both Datadog and Grafana Cloud charge for infrastructure telemetry in different ways. Better Stack takes a different approach: no per-host fees, no per-series cardinality charges, and infra metrics that live alongside uptime monitors, on-call schedules, and incident timelines that make them actionable.
**Infrastructure monitoring connected to alerting, on-call, and incident management, all in one place.** [Get started free.](https://betterstack.com)
[/summary]
---
## Incident management
Both platforms offer incident management, but the pricing structures and what is included by default differ enough that the choice has a real impact on your total bill.
### Datadog: seat-based incident management that still leans on external paging tools
Datadog's incident management is a seat-based SKU. You declare incidents from monitor alerts, security signals, or events, and the platform provides incident tracking, responder assignment, timeline management, and Slack/Teams integration. On-call scheduling is available through Datadog On-Call (launched in late 2024) or through integrations with PagerDuty and OpsGenie. Phone and SMS alert delivery requires those external tools. For teams that need the full alert-to-resolution workflow inside Datadog, it is achievable, but the total cost across Datadog incident seats plus a paging tool adds up quickly.
### Grafana Cloud IRM: on-call built in, but phone delivery still needs an integration

Grafana Cloud IRM, released as a unified product in March 2025 combining OnCall and Incident, costs $20/active IRM user/month. It includes on-call scheduling, escalation policies, incident management, custom incident statuses, private incidents, and Slack/Teams native channel creation. The observability integration is tight: incident responders can pull dashboards, metrics, and logs without leaving IRM context, and Grafana Assistant can summarize what happened during an incident.
What IRM does not include natively: unlimited phone and SMS delivery as a built-in line item. Teams that need reliable phone escalation for critical alerts will need to factor in integration costs. For 5 responders, Grafana Cloud IRM costs $100/month before any phone delivery costs.
| Incident management | Datadog | Grafana Cloud IRM |
|---|---|---|
| Pricing | Seat-based SKU | $20/active IRM user/month |
| Phone/SMS delivery | Via PagerDuty/OpsGenie integration | Via mobile app and integration partners |
| On-call scheduling | Via Datadog On-Call or external tools | Built-in |
| Slack/Teams native | Yes | Yes |
| Post-mortems | Yes | Manual (AI assistance available) |
| Observability integration | Deep (same platform) | Deep (Grafana dashboards + Grafana Assistant) |
| Status pages | No | No |
---
## Digital experience monitoring
Session replay and synthetic monitoring are where Datadog still has a clearer lead. Grafana Cloud has been closing the gap on frontend visibility, but the full picture requires understanding what is and is not included natively.
### Datadog: full digital experience suite with seamless backend correlation

Datadog's Digital Experience suite covers Browser RUM, Mobile RUM (iOS, Android, React Native, Flutter), Session Replay, Synthetic Monitoring, Product Analytics, and Experiments. Session Replay lets you watch exactly how a user experienced a bug. Synthetic Monitoring runs scripted browser tests and API checks from Datadog's global probe network. The frontend-to-backend correlation works seamlessly because RUM and APM share the same backend. The full suite requires purchasing RUM, Session Replay, and Synthetic Monitoring as separate line items, which compounds the cost quickly.
### Grafana Cloud: Core Web Vitals and synthetics included, session replay still requires a third party

Grafana Cloud Frontend Observability ($0.75/1,000 sessions/month on Pro) captures Core Web Vitals, JavaScript errors, session data, and user journey analytics. It integrates with Application Observability for frontend-to-backend trace correlation. What it does not include natively: session replay (requires third-party integration) and mobile RUM.
One area where Grafana Cloud has a genuine edge: Grafana k6 for performance testing is included in the platform. If load testing integration with your observability stack matters, this is something Datadog simply does not offer.
| Digital experience | Datadog | Grafana Cloud |
|---|---|---|
| Browser RUM | Yes | Yes (Frontend Observability) |
| Mobile RUM | Yes (iOS, Android, React Native, Flutter) | No |
| Session replay | Yes | Via third-party integration |
| Synthetic monitoring | Yes | Yes (Grafana Cloud Synthetic Monitoring) |
| Core Web Vitals | Yes | Yes |
| Product analytics | Yes | Yes |
| Performance testing (k6) | No | Yes (included) |
| Frontend-to-backend correlation | Seamless (single backend) | Requires Frontend Obs + Application Obs |
---
## AI capabilities
Both platforms shipped AI products in 2025 that go well beyond basic anomaly detection. The difference is whether the AI acts on your behalf or waits to be asked.
### Datadog Bits AI: autonomous investigation that fires when the alert fires

Datadog launched Bits AI SRE in December 2025 as its first generally available autonomous AI agent. When an alert fires, Bits AI SRE starts investigating without waiting for anyone to prompt it. By the time you reach your laptop, it has typically identified a likely root cause and in some cases proposed a code fix. It reads your runbooks, understands your service topology, and chains hypotheses across logs, metrics, and traces simultaneously. Beyond the AI SRE, Datadog has Bits Chat for conversational observability queries, Bits Code for in-editor assistance, Bits Agent Builder for custom AI workflows, Bits Security Analyst for SIEM triage, and an MCP Server (currently in Preview) for connecting Claude, Cursor, and other AI clients to Datadog data.
### Grafana Cloud Grafana Assistant: deep configuration context, reactive by design

Grafana Assistant reached GA in October 2025. It operates inside the Grafana Cloud UI with deep configuration context: it knows your dashboard structure, your data source configurations, your alert rules, and your metric names. Ask it to create a dashboard and it queries the Prometheus API to enumerate your actual metrics, reasons about the right visualization, and generates the complete dashboard JSON. Ask it to investigate an alert and it queries logs, pulls relevant spans, and summarizes findings.
Grafana Cloud also provides a Grafana Cloud MCP server (available to all users via OAuth 2.1) for external AI clients including Claude Code, Cursor, and VS Code, plus a separate Traces MCP server that ships with Grafana Cloud Traces for direct TraceQL query access. Grafana Assistant is priced at $20/active AI user/month.
The distinction between the two AI approaches is meaningful. Datadog's Bits AI SRE is proactive: it fires automatically when an alert triggers and presents findings without you starting a conversation. Grafana Assistant is reactive and context-rich: you bring the question, and it uses its deep knowledge of your Grafana configuration to give a precise, useful answer. Both patterns are valuable; they suit different moments in an incident.
| AI capability | Datadog | Grafana Cloud |
|---|---|---|
| Autonomous AI investigation (no prompting) | Yes (Bits AI SRE, GA Dec 2025) | Grafana Assistant Investigations |
| In-product AI assistant | Yes (Bits Chat) | Yes (Grafana Assistant, GA Oct 2025) |
| MCP server | Yes (Bits MCP Server, Preview) | Yes (Grafana Cloud MCP server, GA) |
| AI coding assistant integration | Claude, Cursor, etc. | Claude Code, Cursor, VS Code, GitHub Copilot |
| Dashboard creation via AI | Via MCP prompts | Native in Grafana Assistant |
| AI pricing | Included (GA features) | $20/active AI user/month |
| Security AI analyst | Yes (Bits Security Analyst) | No |
[summary]
### AI that also wakes someone up
Both Datadog and Grafana Cloud have AI investigation features. What neither one includes is a direct path from an AI-generated root cause hypothesis to an on-call notification, an incident timeline, and a customer-facing status page update. Better Stack's AI SRE connects to the full incident lifecycle so the investigation and the response happen in the same place.
**Autonomous root cause investigation connected to on-call, incidents, and status pages.** [See the AI SRE.](https://betterstack.com)
[/summary]
---
## Security and compliance capabilities
Security is an area where these platforms diverge sharply, and the gap has real implications depending on your industry and data residency requirements.
### Datadog: Cloud SIEM and a full security platform woven into observability

Datadog has a substantial security platform: Cloud SIEM for threat detection across logs and cloud audit trails, Workload Protection for runtime kernel-level threat detection, App and API Protection against injection attacks and account takeover, Code Security covering SAST/IAST/SCA/IaC scanning and secret scanning, Cloud Security Posture Management, Cloud Infrastructure Entitlement Management, and Vulnerability Management. The integration between security signals and observability data is Datadog's core differentiator here. A security alert and the application trace that triggered it live in the same system, and you can investigate both from the same interface.
### Grafana Cloud: no security product, but stronger data sovereignty story

**Grafana Cloud does not have a security platform in the Datadog sense**. There is no Cloud SIEM, no threat detection, and no security monitoring product. On the compliance side, Grafana Cloud covers SOC 2 Type II, GDPR, HIPAA on Enterprise plans, and FedRAMP in Grafana's Federal Cloud for Enterprise customers.
The data sovereignty story is where Grafana Cloud has a structural advantage that Datadog cannot match. Enterprise customers can run a bring-your-own-cloud deployment in their own AWS, GCP, or Azure account managed by Grafana Labs, or self-host the entire LGTM stack with zero data leaving their network boundary. If your organization has data residency requirements that go beyond selecting a US or EU region, this flexibility is significant.
| Security and compliance | Datadog | Grafana Cloud |
|---|---|---|
| Cloud SIEM | Yes | No |
| Workload protection (runtime) | Yes | No |
| Code security (SAST/IAST/SCA) | Yes | No |
| Cloud security posture management | Yes | No |
| Vulnerability management | Yes | No |
| SOC 2 Type II | Yes | Yes |
| HIPAA | Yes | Yes (Enterprise) |
| FedRAMP | Yes (GovCloud) | Yes (Federal Cloud, Enterprise) |
| Data residency (self-hosted) | No | Yes (BYOC Enterprise, full OSS) |
| Air-gapped deployment | No | Yes (self-hosted OSS) |
---
## Pricing comparison
Pricing is where the comparison becomes consequential in a way that is easy to underestimate before you actually run the numbers.
### Datadog: multidimensional billing that compounds as you add products

Datadog bills across several independent dimensions: per-host for infrastructure ($15 to $23/month) and APM ($31 to $40/month), per-GB for log ingestion ($0.10), per million events for log indexing ($1.70), and per metric for custom metrics beyond the per-host allotment. The high-water mark billing model means a five-day traffic spike sets your bill for the whole month at peak host count. Adding products like RUM, database monitoring, network monitoring, and security compounds the base charges.

For a 100-host deployment with APM, logs, and RUM, Datadog commonly runs $20,000 to $30,000 per month. Enterprise pricing unlocks volume discounts and annual commitments, but you have to accurately forecast your 99th-percentile usage before signing.
### Grafana Cloud: usage-based with a real free tier and Adaptive Telemetry as a cost lever
Grafana Cloud is meaningfully cheaper than Datadog across most realistic workloads. The free tier (10K metrics, 50GB logs, 50GB traces per month) is real and usable for small teams. Pro tier published rates: $6.50/1,000 active series (metrics), roughly $0.55/GB effective (logs), roughly $0.55/GB effective (traces), $7.20/host/month (Kubernetes Monitoring), $18/host/month (Application Observability), $20/active IRM user/month, $20/active AI user/month. Enterprise requires a minimum $25,000/year commitment.
**Scenario: 100 hosts, 1TB logs/month, 50K active metric series**
| Cost component | Datadog (Pro, annual) | Grafana Cloud (Pro) |
|---|---|---|
| Infrastructure monitoring (100 hosts) | $1,500/month | $325/month (50K series at $6.50/1K) |
| APM (100 hosts) | $3,100/month | $1,800/month (Application Observability) |
| Log management (1TB/month) | ~$3,600/month (ingestion + indexing) | ~$550/month effective |
| Kubernetes Monitoring | Included | $720/month ($7.20/host) |
| IRM / incident management (5 responders) | Seat-based + external tools | $100/month ($20 x 5) |
| **Estimated monthly total** | **~$8,200–$12,000+/month** | **~$3,495+/month** |
This is a simplified comparison. Real costs vary based on indexing ratio, Adaptive Metrics/Logs usage, and contract terms. For accurate pricing at your specific usage, both platforms offer calculators and sales conversations.
| Pricing factor | Datadog | Grafana Cloud |
|---|---|---|
| Free tier | No | Yes (10K metrics, 50GB logs, 50GB traces/month) |
| Per-host fee | Yes ($15–$23/month) | No |
| APM per-host | Yes ($31–$40/month) | Application Observability (~$18/host/month) |
| Log effective cost | ~$2.50–$3.00/GB (with indexing) | ~$0.55/GB |
| Custom metric surcharges | Yes | No |
| OTel metric penalty | Yes (treated as custom) | No |
| Cardinality cost reduction | None | Adaptive Metrics (up to 80% reduction) |
| High-water mark billing | Yes | No |
| Self-hosted escape valve | No | Yes (full OSS stack) |
---
[summary]
### Enterprise observability without the vendor-per-tool model
Both Datadog and Grafana Cloud require separate tools for status pages, and both have additional seat or usage charges for incident management. Better Stack consolidates logs, metrics, traces, on-call scheduling, incident management, and status pages into one platform with one bill.
**Fewer vendors, fewer context switches, and a single place for the full reliability workflow.** [Talk to us.](https://betterstack.com)
[/summary]
---
## What each platform genuinely lacks
Being honest about gaps is how you avoid buyer's remorse six months into a contract.
**Datadog gaps worth knowing:**
- No free tier, evaluation requires a paid trial
- No self-hosted option; your telemetry data stays in Datadog's infrastructure permanently
- OpenTelemetry metrics treated as custom metrics, penalizing teams following the open standard
- High-water mark billing means traffic spikes affect your bill for the whole month
- No status pages
- No performance testing (k6 equivalent)
- No open query language; switching backends means rebuilding dashboards and alert rules
**Grafana Cloud gaps worth knowing:**
- Three different query languages (LogQL, PromQL, TraceQL) create investigation friction across signal types
- No Cloud SIEM, no threat detection, no security monitoring product
- Session replay requires third-party integration
- Mobile RUM (iOS, Android) not available natively in Frontend Observability
- Application Observability and Kubernetes Monitoring are separately priced, adding cost complexity
- Grafana Assistant costs $20/user/month, adding to the bill for AI power users
- No status pages
- No unlimited phone/SMS built into IRM
---
## Final thoughts
Datadog and Grafana Cloud represent genuinely different philosophies, and the right choice depends heavily on what you are optimizing for.
**Datadog makes sense when you need a single vendor that covers observability and security in one platform**, when your workflow depends on seamless cross-signal correlation without navigating between panels, when session replay and synthetic monitoring are non-negotiable, when your team does not want to manage or learn multiple query languages, or when the 750+ integrations and the maturity of enterprise support justify the cost. For organizations that have already built Datadog into their entire stack and benefit from cross-product correlation, like having a security alert tied directly to the APM trace that triggered it, the switching cost is hard to justify unless the bill has become genuinely painful.
**Grafana Cloud makes more sense when you are already running Prometheus and Grafana self-hosted and want to move to a managed service** without changing your instrumentation or dashboards; **when data sovereignty or air-gapped deployment is a hard requirement**; when OpenTelemetry adoption is a priority and you do not want to pay a surcharge for following the open standard; when you need the best-in-class visualization layer with access to 700+ data sources; when you want a genuine free tier for small teams or evaluation; or when you need performance testing (k6) integrated with your observability stack.
The cost difference at scale is real: Grafana Cloud typically runs 40 to 60% cheaper than Datadog for equivalent coverage. But that gap comes with real tradeoffs: three query languages, more configuration overhead, no built-in security platform, and APM and Kubernetes products that add separate per-host costs once you enable them.
Whatever direction you go, model the actual bill before you commit. Both platforms have pricing calculators, and both have a tendency to produce surprises once you factor in Adaptive Telemetry savings on the Grafana side or custom metric overages and high-water mark billing on the Datadog side.
[summary]
### One thing neither covers: the full reliability layer
Neither Datadog nor Grafana Cloud includes uptime monitoring, unlimited phone/SMS on-call alerting, incident management, and customer-facing status pages in a single product at a predictable price. Better Stack brings all of that together with logs, metrics, and traces, with usage-based pricing and no per-host fees.
**The full reliability lifecycle in one place. Start free, no credit card required.** [Try Better Stack.](https://betterstack.com)
[/summary]
---
Slug: datadog-vs-grafana-cloud
Title: Datadog vs Grafana Cloud: A Complete Comparison for 2026
Meta description: Datadog vs Grafana Cloud compared across APM, logs, metrics, AI, security, pricing, and enterprise readiness. Understand the real cost difference and which platform fits your stack.