# Datadog vs Elastic Observability: A Complete Comparison for 2026
Datadog and Elastic are not competing for the same buyer in the same way that, say, Datadog and Grafana Cloud are. Elastic built its reputation on Elasticsearch, and observability is one use case within a platform that also covers search, SIEM, XDR, and endpoint security. Datadog built everything from the ground up specifically for monitoring and observability, and it shows in the feature depth and the DX. **What you are really choosing between is a purpose-built observability SaaS with a developer-centric workflow and a broader data platform that happens to do excellent observability.**
That framing matters because it changes which gaps are dealbreakers. **If you need Cloud SIEM, threat detection, or unified search and security alongside observability, Elastic's architecture is genuinely compelling, and the idea of running one platform instead of three separate tools is worth real money.** If you need the deepest possible APM experience, autonomous AI that starts investigating before you open your laptop, and an MCP server that lets your AI coding assistant query your production data, Datadog is the stronger fit.
**Where Elastic consistently gets credit in user reviews is log analytics at scale.** Elasticsearch at the backend means you can search petabytes of data in milliseconds, and the tiered storage model with searchable snapshots lets you keep data for much longer without the eye-watering costs of keeping everything on hot nodes. Where Datadog gets credit is time to value and the investigation workflow: one agent, everything in one view, no context-switching between Kibana sections to go from a trace to the logs around it.
This article covers both tools across architecture, APM, log management, infrastructure monitoring, AI, pricing, and enterprise readiness.
## Quick comparison at a glance
| Feature | Datadog | Elastic Observability |
|---|---|---|
| **Primary strength** | Full-stack observability, developer-centric | Log analytics at scale, unified search + security |
| **Deployment model** | SaaS only | SaaS (Serverless + Hosted), self-managed, hybrid |
| **Free tier** | No | 14-day trial |
| **Starting price** | $15/host/month (infra only) | From $95/month (Standard hosted) |
| **Pricing model** | Per-host + per-GB + per-feature | Resource-based (hosted) or usage-based (serverless) |
| **APM / distributed tracing** | Yes (primary strength) | Yes (EDOT, OTel-native) |
| **Log management** | Yes (two-tier billing) | Yes (primary strength, petabyte-scale) |
| **Infrastructure monitoring** | Yes | Yes (400+ integrations) |
| **Kubernetes monitoring** | Yes | Yes |
| **ML anomaly detection** | Yes (Watchdog) | Yes (zero-config, 100+ preconfigured jobs, Platinum+) |
| **Universal Profiling (eBPF)** | Yes (Continuous Profiler) | Yes (eBPF-based, no instrumentation) |
| **LLM observability** | Yes (Agent Observability) | Yes |
| **Real user monitoring** | Yes (browser + mobile) | Yes |
| **Session replay** | Yes | No |
| **Synthetic monitoring** | Yes | Yes |
| **AI / AIOps** | Yes (Bits AI SRE, autonomous, GA Dec 2025) | Yes (AI Assistant, Streams, AIOps) |
| **MCP server** | Yes (Preview) | Yes |
| **Cloud SIEM / security** | Yes (extensive) | Yes (full SIEM, XDR, endpoint security) |
| **Incident management** | Yes (seat-based add-on) | Not included (integrate PagerDuty/OpsGenie) |
| **Status pages** | No | No |
| **On-call scheduling** | Via Datadog On-Call or external | Not included |
| **Air-gapped / self-hosted** | No | Yes |
| **FedRAMP** | Yes (GovCloud) | Yes (FedRAMP High In Process) |
| **SOC 2 Type II** | Yes | Yes |
| **HIPAA** | Yes | Yes |
---
## Platform architecture and philosophy
Both platforms store logs, metrics, and traces together, which matters for investigation workflows. Where they diverge is everything else: how data gets collected, what sits on top of the storage engine, and who has operational responsibility for keeping it running.
### Datadog: proprietary SaaS optimized for the investigation workflow

You install the Datadog Agent on every host, it collects metrics, logs, and traces, and everything lands in Datadog's hosted infrastructure. The tight integration is the whole value proposition: when an alert fires, you click from the alert to the trace to the surrounding logs to the infrastructure metrics without leaving a single view or changing query languages. Datadog controls the full pipeline from collection to storage to query, and it uses that control to make the investigation workflow genuinely smooth.
The cost of that smoothness is real. Per-host pricing for infrastructure, another per-host charge for APM, per-GB plus per-million-event billing for logs, and the high-water mark model that can set your bill for the month during a traffic spike. Every product you add creates another dimension of cost. And if you use OpenTelemetry instrumentation, Datadog treats those metrics as custom metrics and charges accordingly.
### Elastic: Elasticsearch at the center, composable by deployment model

Elastic puts Elasticsearch at the center of everything. Logs, metrics, traces, and security events all flow into the same engine. Kibana sits on top as the visualization and investigation frontend, with separate sections for APM, Logs, Infrastructure, and Security. Unlike the original siloed Elastic stack of five years ago, the modern platform is genuinely unified at the storage layer.
The deployment flexibility is where Elastic genuinely differentiates. You can run Elastic Cloud Serverless and never touch infrastructure. You can run Elastic Cloud Hosted and control your cluster configuration. You can self-manage via Kubernetes with ECK or run Elastic Cloud Enterprise behind your own firewall. That last option matters for regulated industries and air-gapped environments that Datadog simply cannot serve.
The tradeoff is that Elastic's breadth creates configuration overhead. Kibana presents different query interfaces depending on what you are looking at: ES|QL in some contexts, KQL in others, and PromQL via the metrics integration. The investigation workflow requires navigating between sections rather than having everything surface in one view automatically. User reviews consistently flag the learning curve as real, particularly for teams without prior Elasticsearch experience.
Elastic's Serverless Observability pricing is usage-based on ingest and retention volume, which is genuinely simpler than Elastic Cloud Hosted's resource-based model. The key thing to understand on Serverless is that billing is measured against uncompressed, enriched data at the end of the ingest pipeline, before Elasticsearch's compression runs. Billed volumes are consistently higher than raw data sizes, which is not a hidden fee but is a common source of first-invoice surprise.
| Architectural factor | Datadog | Elastic Observability |
|---|---|---|
| Data collection | Proprietary DD Agent | Elastic Agent + EDOT (OTel-native) |
| Storage | Proprietary SaaS-hosted | Elasticsearch (unified, tiered storage) |
| Query language | Proprietary DQL + some PromQL | ES\|QL, KQL, Lucene (context-dependent) |
| Investigation flow | Single view, cross-signal seamless | Navigate between Kibana sections |
| Deployment options | SaaS only | Serverless, Hosted, self-managed, air-gapped |
| OTel support | Partial (custom metric surcharge) | First-class (EDOT, OTel schema preserved) |
| Vendor lock-in risk | High | Medium (open-source backends, self-hostable) |
[summary]
### Neither Datadog nor Elastic includes a full reliability layer
Both platforms cover telemetry well. Neither includes built-in on-call scheduling with phone and SMS delivery, or customer-facing status pages, as part of the core product. Better Stack brings all of that together alongside logs, metrics, and traces, so you can go from alert to post-mortem without switching tools.
**From heartbeat monitoring to incident timelines to status pages, one platform for the whole reliability lifecycle.** [Start free.](https://betterstack.com)
[/summary]
---
## APM and distributed tracing
Both platforms are OpenTelemetry-native, which is genuinely good news if you have been maintaining proprietary instrumentation. The difference is in how far that OTel support extends and what it costs.
### Datadog: agent-based APM with code-level profiling and a per-host bill
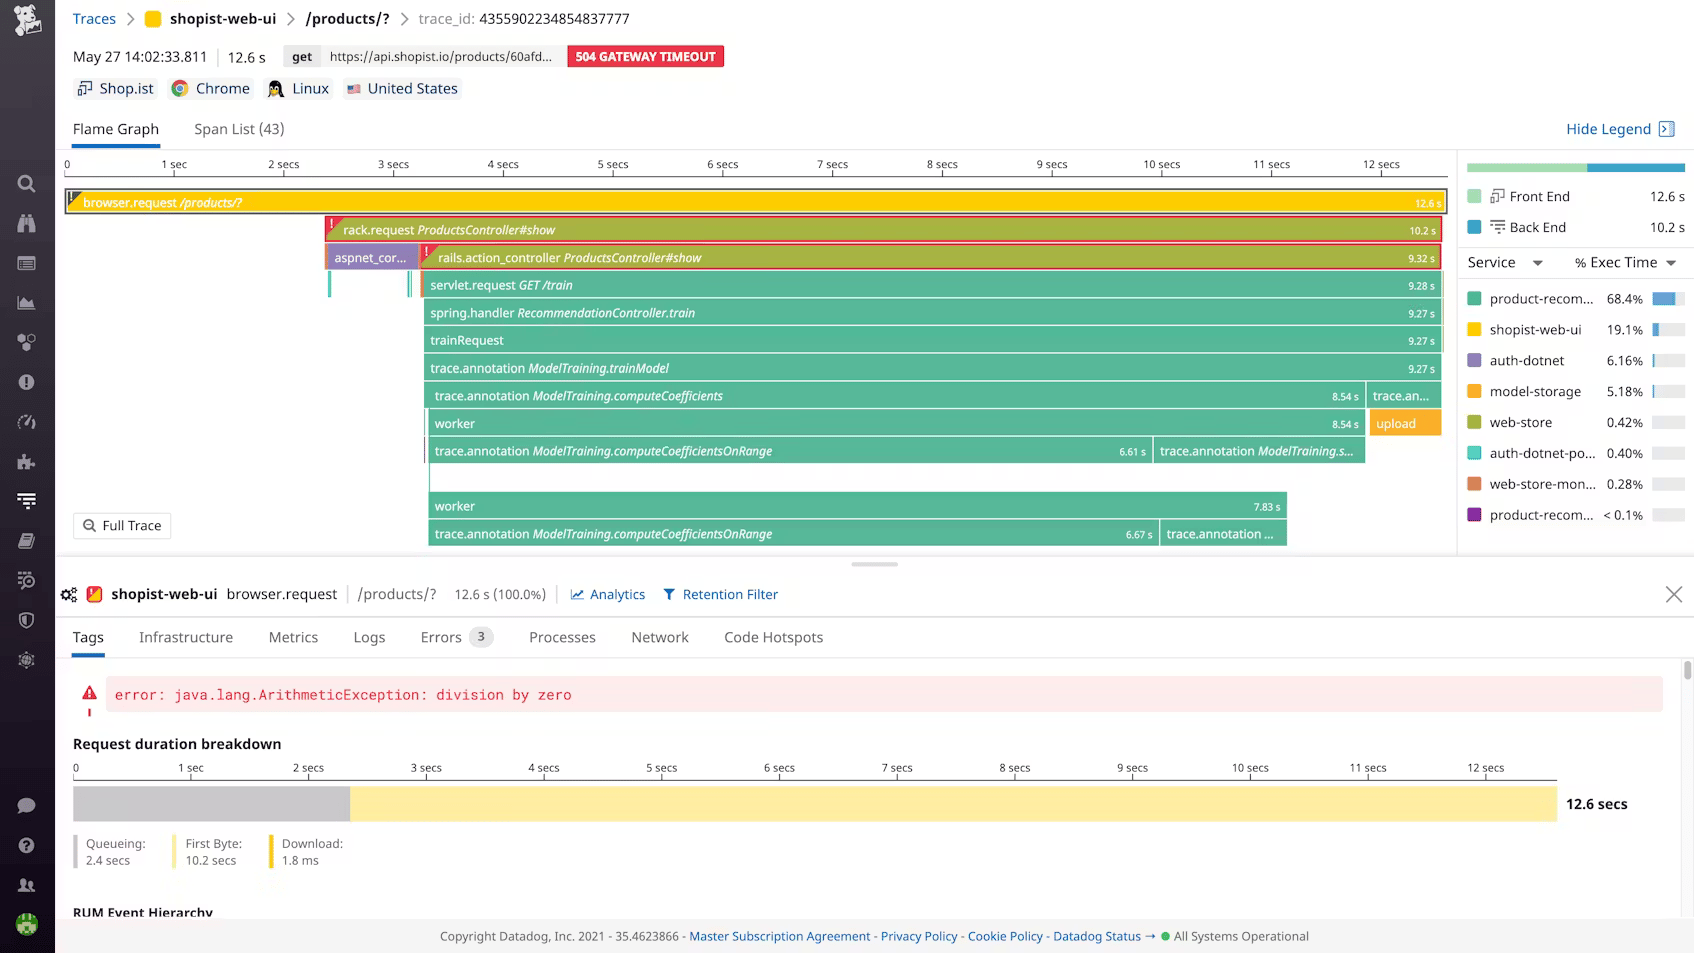
Datadog APM is one of the most feature-complete distributed tracing products available. Service maps visualize live dependencies across your stack. The Continuous Profiler captures code-level CPU and memory usage per function, so you can trace a slow request down to the specific line causing it. Dynamic Instrumentation lets you add log lines and custom metrics to running production services without redeploying. Watchdog surfaces anomalies in trace data automatically.
The frontend-to-backend correlation is seamless because RUM and APM share the same backend. When a page load is slow, you click through to the backend trace without configuring anything. APM costs $31 to $40 per host per month on top of the base infrastructure fee, with 150 GB of ingested spans and 1 million indexed spans per host. High-throughput microservices regularly exceed those limits.
The OTel situation is worth understanding: Datadog supports OTel data, but it treats OTel metrics as custom metrics and charges accordingly. If your organization has invested in OTel instrumentation as a vendor-neutral standard, you are paying a tax for that choice on Datadog.
### Elastic: OTel-first APM with ML correlation built in

Elastic APM is explicitly built around the Elastic Distributions of OpenTelemetry (EDOT). You instrument with standard OTel SDKs and ship data directly to Elastic without proprietary agents. EDOT supports Java, .NET, Python, Node.js, PHP, iOS, and Android, with auto-instrumentation available for several languages. No OTel surcharge, no penalty for using the open standard.
Where Elastic has a genuine edge over Datadog in APM: the machine learning layer. Latency correlation automatically surfaces which request attributes, whether region, customer tier, or endpoint, are statistically associated with elevated latency. Failure correlation identifies which service attributes correlate with errors. These run on your OTel data without additional configuration and are consistently cited in user reviews as meaningful for reducing MTTR.
Elastic also ships Universal Profiling, an eBPF-based continuous profiler that runs at the kernel level without requiring application instrumentation. It gives you code-level visibility into CPU usage across your entire stack without touching a single service. That is a capability Datadog charges separately for with its Continuous Profiler.
The honest tradeoff: Elastic's APM is powerful but requires more configuration to unlock its full depth, and the investigation workflow requires navigating Kibana sections rather than the seamless click-through Datadog provides. G2 and Gartner reviewers consistently flag the learning curve as the main friction.
| APM / tracing | Datadog | Elastic Observability |
|---|---|---|
| Instrumentation | Proprietary SDK per service | EDOT / OTel SDKs (auto-instrumentation available) |
| OTel support | Yes (custom metric surcharge applies) | First-class (EDOT, no surcharge) |
| ML anomaly / latency correlation | Watchdog (alert-driven) | Yes (zero-config, continuous, Platinum+) |
| Code-level profiling | Yes (Continuous Profiler, separate charge) | Yes (Universal Profiling, eBPF-based) |
| Dynamic instrumentation | Yes | No |
| Frontend-to-backend correlation | Seamless (shared backend) | Via RUM + APM configuration |
| Service maps | Yes | Yes (live, interactive in Kibana) |
| APM pricing | $31–$40/host/month (on top of infra) | Included in Observability subscription |
[summary]
### APM without the per-host bill
Both Datadog and Elastic charge separately for APM or include it within a subscription that scales with usage. Better Stack's tracing is priced by data volume with no span indexing fees, no per-host charges, and no cardinality penalties, and the AI SRE activates automatically during incidents to investigate root cause before you have to ask.
**Full-fidelity distributed tracing from every service, priced by volume with no surprises.** [Explore Better Stack tracing.](https://betterstack.com/tracing)
[/summary]
---
## Log management
Log analytics is where Elastic built its entire reputation. The comparison here is between a log management product that works very well and a log management engine that can genuinely operate at petabyte scale, with tiered storage architectures that let you keep data for months without prohibitive cost.
### Datadog: two-tier billing where indexing is where the real cost hides
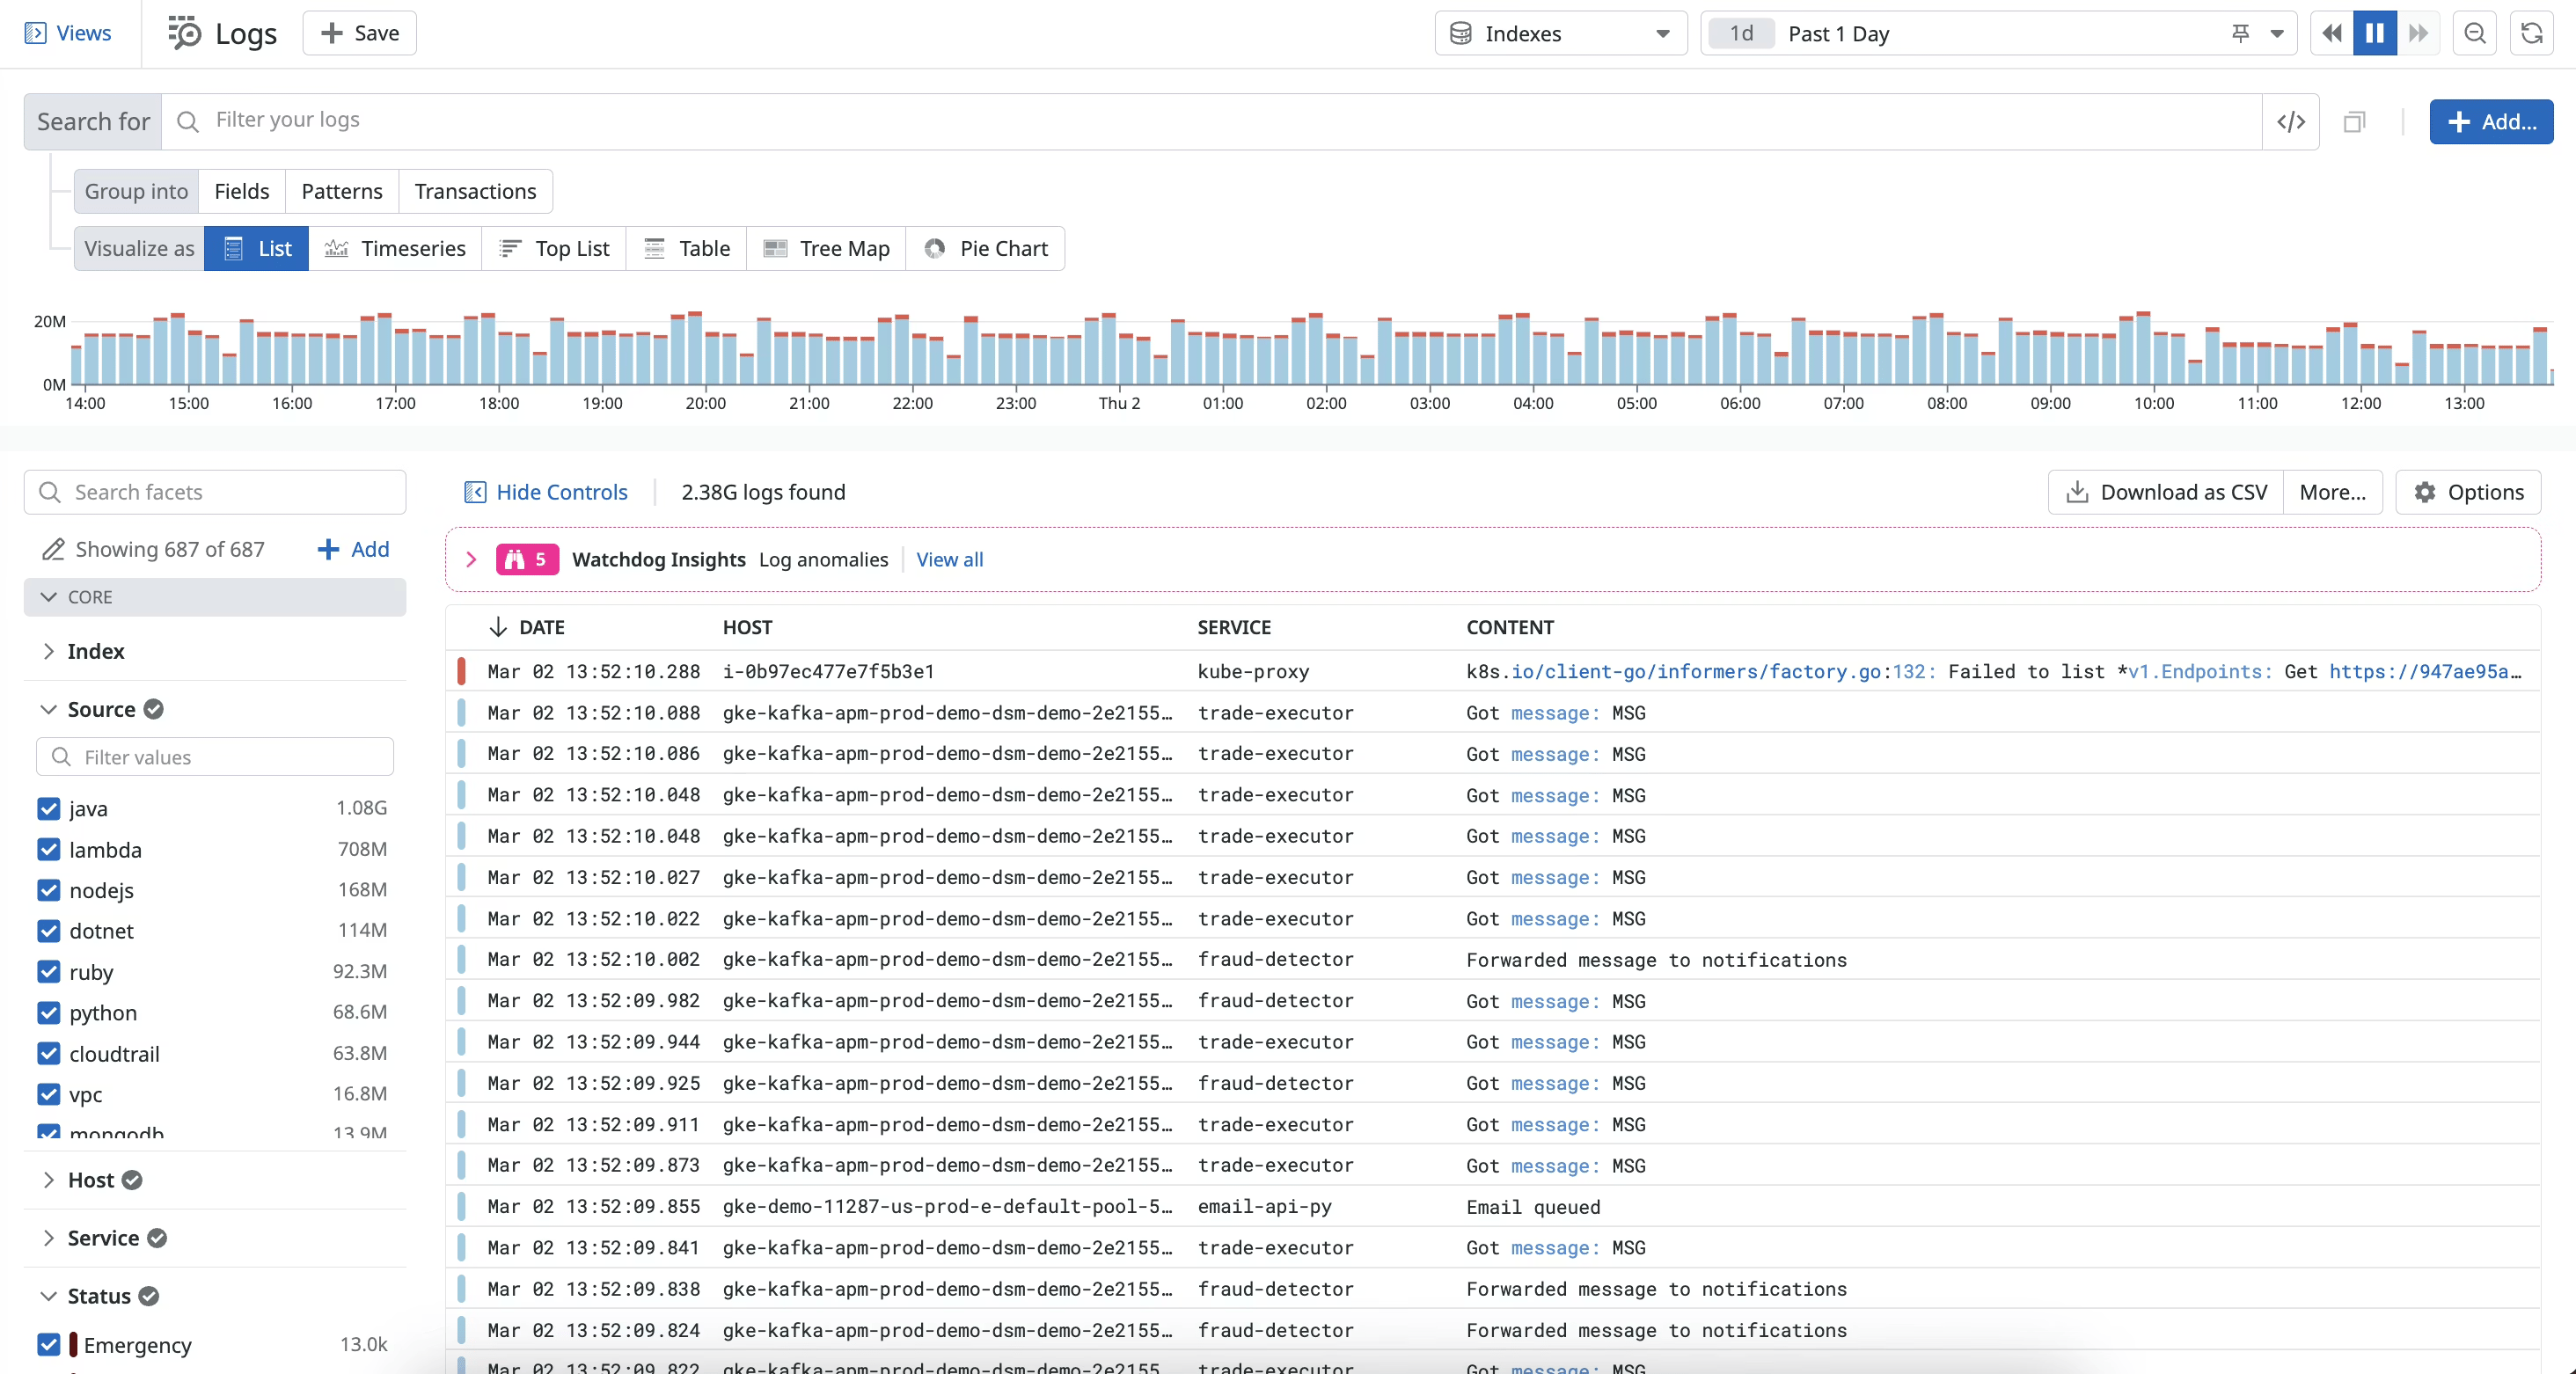
Datadog log management uses a two-tier billing model. You pay $0.10/GB for ingestion, which covers every byte you send whether you search it or not. Then you pay $1.70 per million log events to index them, which is what makes them actually queryable. Most teams end up ingesting everything and indexing selectively, which means a portion of your logs are always sitting in archive and invisible unless you pay to rehydrate them.
The query experience is genuinely strong: faceted search, Log Patterns that cluster similar lines, Sensitive Data Scanner for PII redaction, and seamless correlation to APM traces because everything shares the same backend. The limitation is what it costs at scale. At 10 million log events per day with 15-day retention, independent analysis estimates the Datadog log bill around $5,100 per month for logs alone.
### Elastic: petabyte-scale log analytics with tiered storage and AI-powered pattern detection

Elastic's log analytics is its deepest capability. Elasticsearch's inverted index architecture enables full-text search across petabytes of data in milliseconds, which is why a significant portion of large enterprises run Elasticsearch for log management regardless of what observability tool they use for everything else.
Streams, announced in late 2025, is Elastic's agentic AI-powered log analysis tool. It automatically groups logs into patterns, highlights anomalies, and pinpoints spikes without any manual configuration. The AI Assistant provides conversational access to log data with context from your own runbooks and knowledge bases using RAG, grounded in your actual observability data rather than general model knowledge.
The tiered storage model is a genuine architectural advantage for log retention. Frequently queried recent data stays on hot nodes. Older data transitions automatically through warm, cold, and frozen tiers based on index lifecycle policies you define. Frozen tier offers low-cost archival with searchable snapshots, meaning historical data is queryable without full rehydration. For organizations with compliance requirements mandating long log retention, this capability changes the economics significantly versus Datadog's model where older data requires expensive rehydration.
On Serverless Observability, pricing is per GB ingested and retained. On Hosted, you pay for provisioned resources. Either way, the logsdb index mode and TSDB can reduce your actual stored data footprint by up to 65% through compression, which improves the economics versus the billed ingest volume.
| Log management | Datadog | Elastic Observability |
|---|---|---|
| Billing model | $0.10/GB ingestion + $1.70/million events indexed | Usage-based (serverless) or resource-based (hosted) |
| All logs searchable | Indexed subset only | Yes (tiered, searchable snapshots for cold/frozen) |
| Long-term retention | Expensive rehydration | Frozen tier with searchable snapshots |
| AI log analysis | Alert-driven | Streams (agentic, automatic pattern detection) |
| Query language | Proprietary Log Search | ES\|QL, KQL, Lucene |
| Scale ceiling | Enterprise | Petabyte-scale (Elastic's core strength) |
| Data compression | No | Yes (logsdb, up to 65% storage reduction) |
[summary]
### Log search with no indexing tax
Both Datadog and Elastic have pricing structures that can produce surprises at scale. Better Stack stores logs in a unified warehouse with SQL querying, no separate indexing layer, and no per-event charges. You pay for what you send, and all of it is searchable.
**Unified log management with SQL search, live tail, and no indexing surprises.** [See how it works.](https://betterstack.com/logs)
[/summary]
---
## Infrastructure monitoring and cloud metrics
Both platforms monitor infrastructure comprehensively. The differences are in cardinality pricing, the depth of ML-powered detection, and how infrastructure signals tie back into the investigation workflow.
### Datadog: comprehensive fleet visibility on a stacking per-host model

Datadog infrastructure monitoring starts at $15/host/month on Pro, $23/host/month on Enterprise, and that is just the foundation on which APM, database monitoring, and network monitoring all stack. Host maps give you a visual fleet overview. Kubernetes monitoring covers cluster state, node health, pod metrics, and autoscaling events in depth. Network Performance Monitoring tracks traffic flows between services and through load balancers. Cloud Cost Management ties spending back to infrastructure metrics for FinOps work.
The high-water mark billing is the biggest operational risk. Datadog meters your host count hourly, drops the top 1% of readings, and bills the month at the 99th-percentile peak. A product launch that scales your infrastructure for five days can set your billing rate for the full month. Add OpenTelemetry metrics and you are in custom metrics territory, with surcharges at $1 per 100 beyond the per-host allotment.
### Elastic: deep infrastructure monitoring with zero-config ML and pod-to-APM correlation

Elastic's infrastructure monitoring covers servers, VMs, containers, and serverless environments through 400+ out-of-the-box integrations. Kubernetes monitoring ties pod and container-level metrics directly to the services running on them: when a pod OOMKills, the APM view for the affected service shows the event in context. That infrastructure-to-APM correlation is well-designed and works without manual configuration once the data sources are connected.
The ML anomaly detection is a real differentiator at the Platinum tier. Over 100 preconfigured anomaly detection jobs activate without manual threshold tuning, learning normal behavior and seasonality from your data. On Datadog, anomaly detection exists but is more alert-driven and requires more configuration to get to the same coverage. Neither platform charges cardinality penalties on infrastructure metrics, which puts them on equal footing there.
| Infrastructure monitoring | Datadog | Elastic Observability |
|---|---|---|
| Base pricing | Per-host ($15–$23/month) | Included in Observability subscription |
| High-water mark billing | Yes | No |
| ML anomaly detection | Yes (Watchdog, alert-driven) | Yes (zero-config, 100+ jobs, Platinum+) |
| Kubernetes depth | Yes (deep) | Yes (pod-to-APM correlation) |
| Network performance monitoring | Yes (NPM product) | Limited |
| Cardinality penalties | Yes (custom metrics) | No |
| Integration count | 750+ | 400+ |
[summary]
### Infrastructure metrics connected to the full reliability workflow
Both Datadog and Elastic charge for infrastructure telemetry in ways that scale with your fleet. Better Stack takes a different approach: no per-host fees, no cardinality penalties, and infra metrics that live alongside uptime monitors, on-call schedules, and incident timelines.
**Infrastructure monitoring connected to alerting, on-call, and incident management, all in one place.** [Get started free.](https://betterstack.com)
[/summary]
---
## Digital experience monitoring
Datadog has a more complete digital experience suite in terms of feature breadth, particularly around session replay and mobile RUM. Elastic's strength is in synthetic monitoring depth and the integration of uptime data into the broader observability stack.
### Datadog: full digital experience suite with seamless backend correlation

Datadog's Digital Experience suite covers Browser RUM, Mobile RUM across iOS, Android, React Native, and Flutter, Session Replay, Synthetic Monitoring, Product Analytics, and Experiments. Session Replay lets you watch a recording of exactly what the user experienced when they hit a bug. The frontend-to-backend correlation is seamless because RUM and APM share the same backend. Each component is a separate line item on the bill.
### Elastic: digital experience monitoring with synthetic testing and mobile APM

Elastic's digital experience monitoring covers real user monitoring for web, mobile APM for iOS and Android via Elastic APM agents, synthetic monitoring with multi-step user journey tests running from Elastic's globally managed infrastructure, and uptime monitoring. The synthetic testing is well-built: you can execute complex scripted user journeys and alert when critical flows degrade, which is something Datadog also offers but at an additional line-item cost.
What Elastic does not have is session replay. If watching a user session recording to understand what they experienced before a bug is a core part of your frontend debugging workflow, that is a gap. Elastic's RUM also does not include the product analytics features, auto-captured event funnels, or UTM-based website analytics that Datadog's more comprehensive suite provides.
| Digital experience | Datadog | Elastic Observability |
|---|---|---|
| Browser RUM | Yes | Yes |
| Mobile RUM | Yes (iOS, Android, React Native, Flutter) | Yes (iOS, Android via APM agents) |
| Session replay | Yes | No |
| Synthetic monitoring | Yes | Yes (multi-step, global infrastructure) |
| Product analytics / funnels | Yes | Limited |
| Frontend-to-backend correlation | Seamless (shared backend) | Via RUM + APM configuration |
| Pricing | Per session + separate SKUs | Included in Observability subscription |
---
## AI capabilities
Both platforms made significant AI investments in 2025 and 2026, but the philosophy behind each is different. Datadog's AI is proactive and autonomous. Elastic's AI is embedded throughout the platform and deeper on the analytics side.
### Datadog Bits AI: autonomous investigation that starts without you

Datadog's Bits AI SRE went GA in December 2025 as the platform's first autonomous AI agent. When an alert fires, it starts investigating immediately without waiting for you to prompt it. By the time you open your laptop it has typically identified a likely root cause from APM traces, logs, and metrics, and in some cases proposed a code fix. Beyond Bits AI SRE, there is Bits Chat for conversational queries, Bits Code for in-editor help, Bits Security Analyst for SIEM triage, and an MCP Server in Preview that lets Claude, Cursor, and other AI coding tools query your Datadog data directly.
The autonomy is what makes Bits AI SRE genuinely useful at 3am. You do not have to start a conversation. The investigation is already in progress when you arrive.
### Elastic: AI Assistant and AIOps embedded throughout the platform

Elastic's AI story is broader and in some dimensions deeper than Datadog's, particularly on the continuous analytics side. The AI Assistant is embedded throughout Kibana and is grounded via RAG in your actual observability data and knowledge bases, not just general model knowledge. Ask it to investigate an alert and it pulls logs, traces, and relevant runbook context into a coherent response. Ask it to create a dashboard and it queries the Prometheus API to enumerate your actual metrics before generating the JSON.
The AIOps capabilities are where Elastic's ML investment shows most clearly. Zero-config anomaly detection models normal behavior and seasonality from your data without manual threshold tuning. Streams groups logs into patterns and highlights anomalies automatically. Latency and failure correlation continuously identify which request attributes are statistically linked to degraded performance. These run persistently on your data, not just when you start a conversation.
Elastic does have an MCP server, and user reviews on G2 mention it as a useful integration point. The AI story lives primarily inside Kibana rather than exposing itself to external AI clients the way Datadog's MCP server does for Claude and Cursor.
For security-specific AI, Elastic has Attack Discovery, which uses LLMs to correlate related security alerts into simplified threat summaries. That has no equivalent in Datadog's observability stack.
| AI capability | Datadog | Elastic Observability |
|---|---|---|
| Autonomous investigation (no prompting) | Yes (Bits AI SRE, GA Dec 2025) | AI Assistant (prompt-driven) |
| Zero-config ML anomaly detection | Watchdog (alert-driven) | Yes (100+ jobs, continuous, Platinum+) |
| Log pattern analysis | No | Yes (Streams, automatic) |
| Latency / failure correlation | Alert-driven | Yes (ML-powered, continuous) |
| MCP server | Yes (Preview, developer-facing) | Yes |
| In-product AI assistant | Yes (Bits Chat) | Yes (AI Assistant, RAG-grounded) |
| AI for security | Yes (Bits Security Analyst) | Yes (Attack Discovery, EASE) |
[summary]
### AI that also wakes someone up
Both Datadog and Elastic have AI investigation features. What neither one includes is a direct path from a root cause hypothesis to an on-call notification, an incident timeline, and a customer-facing status page update. Better Stack's AI SRE connects to the full incident lifecycle so the investigation and the response happen in the same place.
**Autonomous root cause investigation connected to on-call, incidents, and status pages.** [See the AI SRE.](https://betterstack.com)
[/summary]
---
## Security capabilities
Security is where the platforms diverge most sharply, and it is the most important section if your evaluation includes security monitoring alongside observability.
### Datadog: Cloud SIEM and a full security platform woven into observability

Datadog has a serious security platform: Cloud SIEM for threat detection across logs and cloud audit trails, Workload Protection for runtime kernel-level threat detection, App and API Protection against injection attacks and account takeover, Code Security covering SAST, IAST, SCA, IaC scanning, and secret detection, Cloud Security Posture Management, and Vulnerability Management. The integration between security signals and observability data is Datadog's core differentiator here, because a security alert and the APM trace that triggered it live in the same system and are visible from the same interface.
### Elastic: full SIEM, XDR, and endpoint security as a first-class platform

Elastic Security is a full SIEM, XDR, and endpoint security platform built on Elasticsearch. It is named a Leader in the 2025 Gartner Magic Quadrant for Observability Platforms, a Visionary in the Gartner Magic Quadrant for SIEM, and a Leader in the Forrester Wave for Security Analytics Platforms. The detection rules are MITRE ATT&CK aligned and available on GitHub, making them inspectable and community-hardened, which is a meaningful difference from proprietary rule sets.
Attack Discovery uses LLMs to correlate related alerts into comprehensible threat summaries, reducing the cognitive overhead of working through a high-volume alert queue. The Elastic AI SOC Engine (EASE) layers AI-driven alert correlation onto existing Splunk or Microsoft Sentinel deployments without requiring a full migration, which is useful for organizations with complex hybrid security tooling.
XDR and endpoint security are native to Elastic, not bolt-ons. Elastic Defend provides endpoint protection, and cloud security covers AWS, Azure, and GCP. If you are evaluating a unified security and observability platform rather than treating them as separate procurement decisions, Elastic's architecture is genuinely designed for that in a way Datadog's is not.
| Security | Datadog | Elastic |
|---|---|---|
| Cloud SIEM | Yes | Yes (full, AI-powered, MITRE ATT&CK) |
| XDR / endpoint security | No | Yes (Elastic Defend) |
| Workload protection (runtime) | Yes | Yes |
| Code security (SAST/IAST/SCA) | Yes | Yes |
| AI threat triage | Yes (Bits Security Analyst) | Yes (Attack Discovery, EASE) |
| FedRAMP | Yes (GovCloud) | Yes (High In Process) |
| HIPAA | Yes | Yes |
| Self-hosted / air-gapped | No | Yes |
| Customer-managed encryption (BYOK) | No | Yes (AWS KMS, Azure Key Vault, GCP KMS) |
---
## Incident management and alerting
Neither platform owns your full incident response workflow, but Datadog comes closer with Datadog On-Call. Elastic's alerting is solid, but it routes to external tools for everything beyond alert delivery.
### Datadog: seat-based incident management with On-Call
Datadog's incident management is a seat-based SKU covering incident declaration, responder assignment, timeline management, and Slack/Teams integration. On-call scheduling is available through Datadog On-Call, launched in late 2024, or through PagerDuty and OpsGenie integrations. Phone and SMS delivery requires those external tools. SLO tracking is available natively and fires alerts when you are burning down error budget faster than expected.
### Elastic: alerting and SLO tracking without incident management

Elastic's alerting layer covers metrics, logs, APM signals, infrastructure health, and SLO burn rate conditions. The SLO tracking is well-designed: you define error budgets based on your observability data, and Elastic alerts when you are burning down budget at a rate that threatens your target. That is genuinely useful for SRE workflows.
What Elastic does not include is on-call scheduling, escalation policies, phone and SMS delivery, or structured incident response workflows. For those you are integrating PagerDuty, OpsGenie, or similar tools. For five responders on PagerDuty, that adds roughly $245 to $415 per month on top of your Elastic contract.
| Incident management | Datadog | Elastic Observability |
|---|---|---|
| Native incident management | Yes (seat-based) | No (integrations only) |
| On-call scheduling | Via Datadog On-Call or external | Not included |
| Phone/SMS delivery | Via Datadog On-Call or external | Via PagerDuty/OpsGenie |
| SLO tracking | Yes | Yes (native, with burn rate alerting) |
| Cases / incident tracking | Yes | Yes (Cases feature in Kibana) |
| Status pages | No | No |
[summary]
### Enterprise observability without the multi-vendor model
Both Datadog and Elastic require separate tools for status pages and on-call scheduling with phone and SMS delivery. Better Stack consolidates logs, metrics, traces, on-call scheduling, incident management, and status pages into one platform with one bill.
**Fewer vendors, fewer context switches, and a single place for the full reliability workflow.** [Talk to us.](https://betterstack.com)
[/summary]
---
## Pricing comparison
The pricing structures are different enough that you need to know your specific data volume and usage pattern before the comparison is meaningful.
### Datadog: multidimensional billing that compounds with every product you add

Datadog charges separately across several independent dimensions: infrastructure at $15 to $23 per host per month, APM at $31 to $40 per host per month on top of that, log ingestion at $0.10/GB, log indexing at $1.70 per million events, and custom metrics beyond the per-host allotment at $1 per 100. The high-water mark billing model means a traffic spike during your biggest week of the year sets your billing rate for the entire month. Every new product you enable adds another billing dimension.

A 100-host deployment with APM, logs, and RUM commonly runs $20,000 to $30,000 per month. Real estate organizations migrating from Datadog to Elastic have reported $150,000 per month in savings at scale, though those numbers depend heavily on the specific feature mix and negotiated contract terms.
### Elastic: subscription tiers plus usage, with meaningful compression benefits
Elastic Observability uses subscription tiers on Hosted: Standard starting at $95/month, Platinum at $125/month (adds full AI Assistant and 99.95% SLA, which independent analysis considers the right tier for most production workloads), and Enterprise at $175/month. On Serverless Observability, pricing is usage-based on ingest and retention volume, which is simpler for variable workloads.
The logsdb index mode and TSDB compression can reduce your stored data footprint by up to 65% compared to raw data, which materially improves the effective cost per GB of retained data. The frozen tier with searchable snapshots keeps historical data accessible at very low cost, which changes the economics of long-term log retention entirely compared to Datadog's rehydration-based model.
The key nuance on Serverless: billing is measured against the uncompressed, enriched data at the end of the ingest pipeline, before Elasticsearch compression runs. Billed volumes are consistently higher than raw source data sizes. This is disclosed, but it is a common source of first-invoice surprise and worth accounting for in any budget estimate.
| Pricing factor | Datadog | Elastic Observability |
|---|---|---|
| APM included | No (additional $31–$40/host) | Yes (included in Observability subscription) |
| Log ingestion | $0.10/GB + $1.70/million events indexed | Usage-based (serverless) or resource-based (hosted) |
| Long-term retention | Expensive rehydration | Frozen tier with searchable snapshots |
| High-water mark billing | Yes | No |
| OTel metric surcharges | Yes (custom metrics) | No |
| Session replay | Per session, separate SKU | Not available |
| Self-managed option | No | Yes |
| Data compression | No | Yes (up to 65% storage reduction) |
---
## What each platform genuinely lacks
**Datadog gaps worth knowing:**
- No free tier; evaluation requires a paid trial
- No self-hosted or air-gapped deployment option
- OpenTelemetry metrics treated as custom metrics with surcharges
- High-water mark billing can move your bill unexpectedly from a traffic spike
- No status pages
- No session replay cost included in log management; each DEM feature is a separate SKU
- No XDR or endpoint security
**Elastic gaps worth knowing:**
- No session replay
- Investigation workflow requires navigating between Kibana sections rather than having everything surface in one view automatically
- Three different query interfaces depending on context (ES|QL, KQL, Lucene) create a steeper learning curve
- No incident management, no on-call scheduling, no phone/SMS delivery
- No status pages
- Serverless billing based on uncompressed ingest volume, which is consistently higher than raw data size estimates
- Getting full value from Elastic requires more Elasticsearch expertise than most teams have initially
- Self-managed Elastic adds significant operational overhead for cluster sizing, ILM policies, and version upgrades
---
## Final thoughts
The honest version of this comparison is that Datadog and Elastic are solving adjacent but somewhat different problems, and your answer probably depends on whether observability is a standalone requirement or part of a broader data and security consolidation.
**If your primary goal is the best observability experience for engineering and SRE teams, with the smoothest investigation workflow, the most autonomous AI investigation, and the deepest APM tooling, Datadog is the stronger product.** The MCP server lets your AI coding tools query your production data directly. Bits AI SRE is running root cause analysis by the time you open your laptop. The investigation workflow never asks you to switch Kibana sections or change query languages. You pay a premium for all of that, and the bill can grow in ways that require active management.
**If your goal is to consolidate observability and security into one platform, handle very large log volumes cost-effectively, deploy in self-hosted or air-gapped environments, or use SIEM and XDR alongside observability, Elastic is the more capable product for that use case.** The learning curve is real and the Elasticsearch expertise requirement is genuine, but the platform's depth is also genuine.
One thing worth modeling explicitly before committing to either platform: run the actual log volume numbers. Datadog's two-tier billing gets expensive quickly at high ingestion volumes, and Elastic's uncompressed ingest billing on Serverless produces higher-than-expected totals. Both platforms have calculators, and both have a tendency to produce first-invoice surprises if you estimated based on raw data sizes rather than actual billing dimensions.
[summary]
### One thing neither covers: the full reliability layer
Neither Datadog nor Elastic includes uptime monitoring, unlimited phone/SMS on-call alerting, incident management, and customer-facing status pages in a unified product. Better Stack brings all of that together with logs, metrics, and traces, with usage-based pricing and no per-host fees.
**The full reliability lifecycle in one place. Start free, no credit card required.** [Try Better Stack.](https://betterstack.com)
[/summary]