# Datadog vs Coralogix: A Complete Comparison for 2026
Coralogix just raised $200 million at a $1.6 billion valuation, and the pitch behind that round is worth understanding before you read any feature comparison. The company's CEO told TechCrunch that more than half of Coralogix's enterprise customers now investigate incidents through Olly or AI and CLI interfaces rather than traditional dashboards. **The bet is that the way engineers interact with observability data is fundamentally changing, and Coralogix wants to own the interface layer of the agentic era.**
That context matters because Coralogix is not positioning itself as a cheaper Datadog with the same architecture. **The platform is built differently at a structural level, and those structural differences have real consequences for how you investigate incidents, how your data is stored, and what you pay.**
Datadog is an integrated SaaS platform where you install one agent and everything flows into one proprietary backend. The investigation workflow is seamless by design: click from an alert to a trace to the surrounding logs to the infrastructure metrics without switching query languages or product screens. The cost for that seamlessness is real, and it compounds with every product you add.
Coralogix built its platform around in-stream processing and customer-owned storage. Your data lives in your own S3 or GCS bucket. The Streama engine processes telemetry as it flows through, so alerts fire before data is even indexed. Olly is not an AI assistant that responds to prompts but a multi-agent autonomous investigator that decides which data sources are relevant to a problem, executes queries, and shows you its reasoning step by step. The pricing is units-based with unlimited users and hosts and all features included.
**Where Datadog is clearly ahead:** the seamless single-view investigation experience, Cloud SIEM with workload protection and code security, session replay, and an autonomous AI that fires without prompting at alert time. **Where Coralogix is clearly ahead:** customer-owned data storage, a compliance portfolio that includes PCI DSS, ISO 27001, and FCA alongside the standard certifications, an AI agent monitoring suite for production LLM applications, and pricing that does not compound with every product you add.
This article covers both platforms honestly across architecture, APM, logs, infrastructure, AI, pricing, security, and enterprise readiness.
## Quick comparison at a glance
| Feature | Datadog | Coralogix |
|---|---|---|
| **Deployment model** | SaaS only | SaaS (data stored in your own S3/GCS) |
| **Free tier** | No | 14-day trial |
| **Starting price** | $15/host/month (infra only) | Units-based ($0.42/GB logs, $0.16/GB traces, $0.05/GB metrics) |
| **Pricing model** | Per-host + per-GB + per-feature | Units-based (all features included) |
| **Custom metric surcharges** | Yes | No |
| **Unlimited users + hosts** | No | Yes |
| **Data ownership** | Datadog-hosted | Your S3/GCS/Azure bucket |
| **Query language** | Proprietary DQL + some PromQL | DataPrime + PromQL + Lucene |
| **OTel-native** | Partial (custom metric surcharge) | Yes (first-class) |
| **APM / distributed tracing** | Yes (primary strength) | Yes (OTel-native, code-level profiling) |
| **Continuous profiling** | Yes (Continuous Profiler) | Yes (code-level) |
| **Log management** | Yes (two-tier billing) | Yes (in-stream, infinite retention) |
| **Infrastructure monitoring** | Yes | Yes (fleet management, cross-account) |
| **Real user monitoring** | Yes (browser + mobile) | Yes (browser + mobile) |
| **Session replay** | Yes | Yes |
| **Synthetic monitoring** | Yes | Yes |
| **SLO management** | Yes | Yes |
| **Serverless APM** | Yes | Yes |
| **AI agent (autonomous)** | Yes (Bits AI SRE, fires on alert) | Yes (Olly, multi-agent, initiated then autonomous) |
| **MCP server** | Yes (Preview) | Yes (GA, all customers) |
| **AI agent monitoring (LLMs)** | Limited | Yes (AI Center, full suite) |
| **Cloud SIEM** | Yes (extensive) | Yes (2,500+ rules, in-stream) |
| **MDR** | No | Yes (via Snowbit.io) |
| **Workload protection** | Yes | No |
| **Code security (SAST/IAST/SCA)** | Yes | No |
| **Incident management** | Yes (seat-based add-on) | Via integrations (PagerDuty/OpsGenie) |
| **Status pages** | No | No |
| **On-call scheduling** | Via Datadog On-Call or external | Not included |
| **SOC 2 Type II** | Yes | Yes |
| **HIPAA** | Yes | Yes |
| **PCI DSS** | No | Yes |
| **ISO 27001** | No | Yes |
| **FCA** | No | Yes |
---
## Platform architecture and philosophy
The architectural difference between these two platforms is not just a technical detail. It determines where your data lives, who owns it, how quickly alerts fire, and what kind of portability you have if you ever want to leave.
### Datadog: one agent, one proprietary backend, one coherent investigation workflow

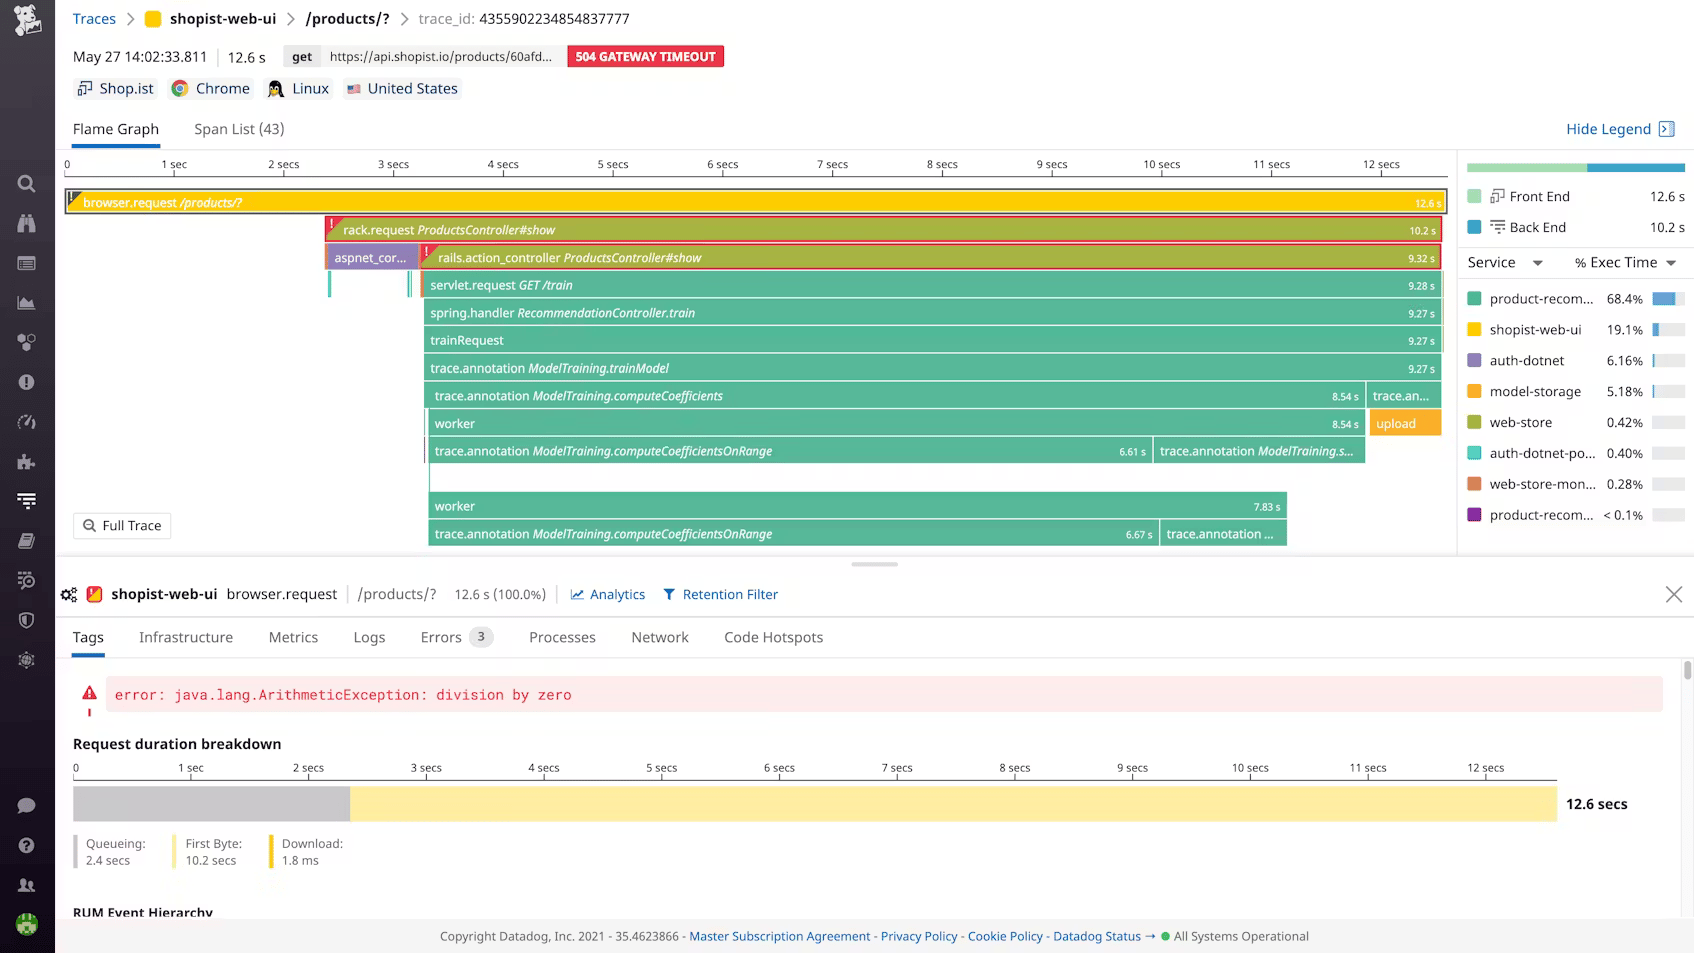
You install the Datadog Agent on every host, everything flows into Datadog's hosted infrastructure, and the investigation workflow is designed to be seamless. When an alert fires, you click from the alert to the trace to the surrounding logs to the infrastructure metrics without switching interfaces or query languages. Datadog controls the full pipeline from collection to storage to query, and that control is what makes cross-signal investigation feel natural.
The cost of that control is also real. Per-host pricing for infrastructure, another per-host charge for APM, per-GB plus per-million-event billing for logs, and a high-water mark billing model that sets your monthly rate based on your peak host count. Every product you add creates another billing dimension. And if you use OpenTelemetry, Datadog treats those metrics as custom metrics and bills accordingly.
### Coralogix: in-stream processing with your data in your own bucket

Coralogix's Streama engine processes all telemetry as it flows through the platform, before anything reaches storage. Alerts fire, anomaly detection runs, and ML models learn normal behavior from data that has not yet been indexed anywhere. There is no gap between an event occurring and your alerting system reacting to it.
After Streama, data flows to one of three destinations you configure via the TCO Optimizer. Frequent Search is hot, indexed storage with instant query response. Monitoring is in-stream analysis that powers alerting but is not available for ad-hoc querying after the fact. Archive is your own S3 or GCS bucket, where data lives at cloud storage prices with infinite retention. You can query archive data directly from the Coralogix interface.
The customer-owned storage model is one of Coralogix's most meaningful architectural choices. Your logs, traces, and metrics live in your own cloud account in open formats. If you leave Coralogix, your data is already in your possession. Coralogix compresses logs 5x before writing to your bucket, so the effective S3 cost is around $0.003 per GB.
The tradeoff is the routing decision. Data routed to Monitoring cannot be queried ad-hoc. Data in Archive has slower query response. Getting that classification right in advance requires judgment about what will matter during an incident you have not had yet. And the DataPrime query language, while powerful for cross-telemetry joins and complex aggregations, is proprietary. Every query your team builds, every saved dashboard, every investigation workflow is written in a syntax that only works inside Coralogix. That is a different kind of lock-in from data format lock-in, and worth factoring into a multi-year platform decision.
| Architectural factor | Datadog | Coralogix |
|---|---|---|
| Data collection | Proprietary DD Agent | OTel collector + optional eBPF |
| Processing model | Ingest, index, query | In-stream analysis, then tiered storage |
| Data storage | Datadog-hosted | Your S3/GCS/Azure bucket |
| Query language | Proprietary DQL + PromQL | DataPrime + PromQL + Lucene |
| OTel support | Partial (custom metric surcharge) | First-class (no surcharge) |
| Alert latency | Standard | Zero (in-stream, before indexing) |
| Data ownership | Vendor | Customer |
[summary]
### Neither Datadog nor Coralogix covers the full reliability picture
Both platforms focus on observability and alerting. Neither includes built-in on-call scheduling with phone and SMS delivery or customer-facing status pages as part of the core product. Better Stack brings all of that together alongside logs, metrics, and traces, so you can go from alert to post-mortem without switching tools.
**From heartbeat monitoring to incident timelines to status pages, one platform for the whole reliability lifecycle.** [Start free.](https://betterstack.com)
[/summary]
---
## APM and distributed tracing
Both platforms are OTel-native for APM with no proprietary SDK requirement. The differences are in depth of code-level visibility, what is included without extra charges, and how APM data connects to the broader investigation flow.
### Datadog: agent-based APM with the deepest tooling in the category
Datadog APM is one of the most feature-complete distributed tracing products available. Service maps, Continuous Profiler for code-level CPU and memory attribution, Dynamic Instrumentation for adding log lines to production without redeploying, Watchdog for automatic anomaly detection. The frontend-to-backend correlation is seamless because RUM and APM share the same backend.
APM costs $31 to $40 per host per month on top of the base infrastructure fee. High-throughput microservices regularly exceed the included span limits. OTel instrumentation triggers custom metric charges.
### Coralogix: OTel-native APM with code-level profiling and SLO management included

Coralogix APM is built entirely on OpenTelemetry with no custom metric surcharge. The service catalog gives you a live health status view across all services with request volume, error rates, P95 latency, and custom filtering by environment or team. Dependency mapping shows every connection between services, databases, and third-party APIs with impact analysis when things break.
Continuous profiling at the code level is included: which functions consume CPU and where memory allocations happen in production, without performance overhead. Serverless APM covers Lambda invocations. SLO management is built in with error budget tracking and burn rate alerting. Database monitoring surfaces slow queries and links them directly to the originating traces. APM costs are included in the units-based pricing rather than stacking as a separate per-host charge.
The span metric cap (300,000 unique combinations) requires monitoring if you are generating high-cardinality APM data, but it is a configuration constraint rather than a billing penalty.
| APM / tracing | Datadog | Coralogix |
|---|---|---|
| Instrumentation | Proprietary SDK per service | OTel SDKs + optional eBPF |
| OTel support | Yes (custom metric surcharge) | Yes (first-class, no surcharge) |
| Code-level profiling | Yes (Continuous Profiler) | Yes |
| Dynamic instrumentation | Yes | No |
| Serverless APM | Yes | Yes |
| SLO management | Yes | Yes (built-in, with error budgets) |
| Database monitoring | Yes (separate product) | Yes (built-in, trace-linked) |
| APM pricing | $31–$40/host/month (on top of infra) | Included in units |
[summary]
### APM without the per-host bill
Both Datadog and Coralogix charge for APM separately from infrastructure. Better Stack's tracing is priced by data volume with no span indexing fees, no per-host charges, and no cardinality penalties, and the AI SRE activates automatically during incidents to investigate root cause before you have to ask.
**Full-fidelity distributed tracing from every service, priced by volume with no surprises.** [Explore Better Stack tracing.](https://betterstack.com/tracing)
[/summary]
---
## Log management
Log management is where the in-stream architecture and customer-owned storage create the most concrete differences from Datadog. The comparison is between a well-designed two-tier SaaS product and an in-stream engine with infinite retention at cloud storage prices in your own account.
### Datadog: two-tier billing where indexing is where the real cost hides
You pay $0.10/GB for log ingestion regardless of whether you ever search those logs. Then you pay $1.70 per million events to index them, making them queryable. Most teams ingest everything and index selectively, which means some portion of your logs are always sitting in archive and invisible for ad-hoc investigation unless you pay to rehydrate them. At 100 GB/day, the Datadog log bill alone approaches $107,000 per year.
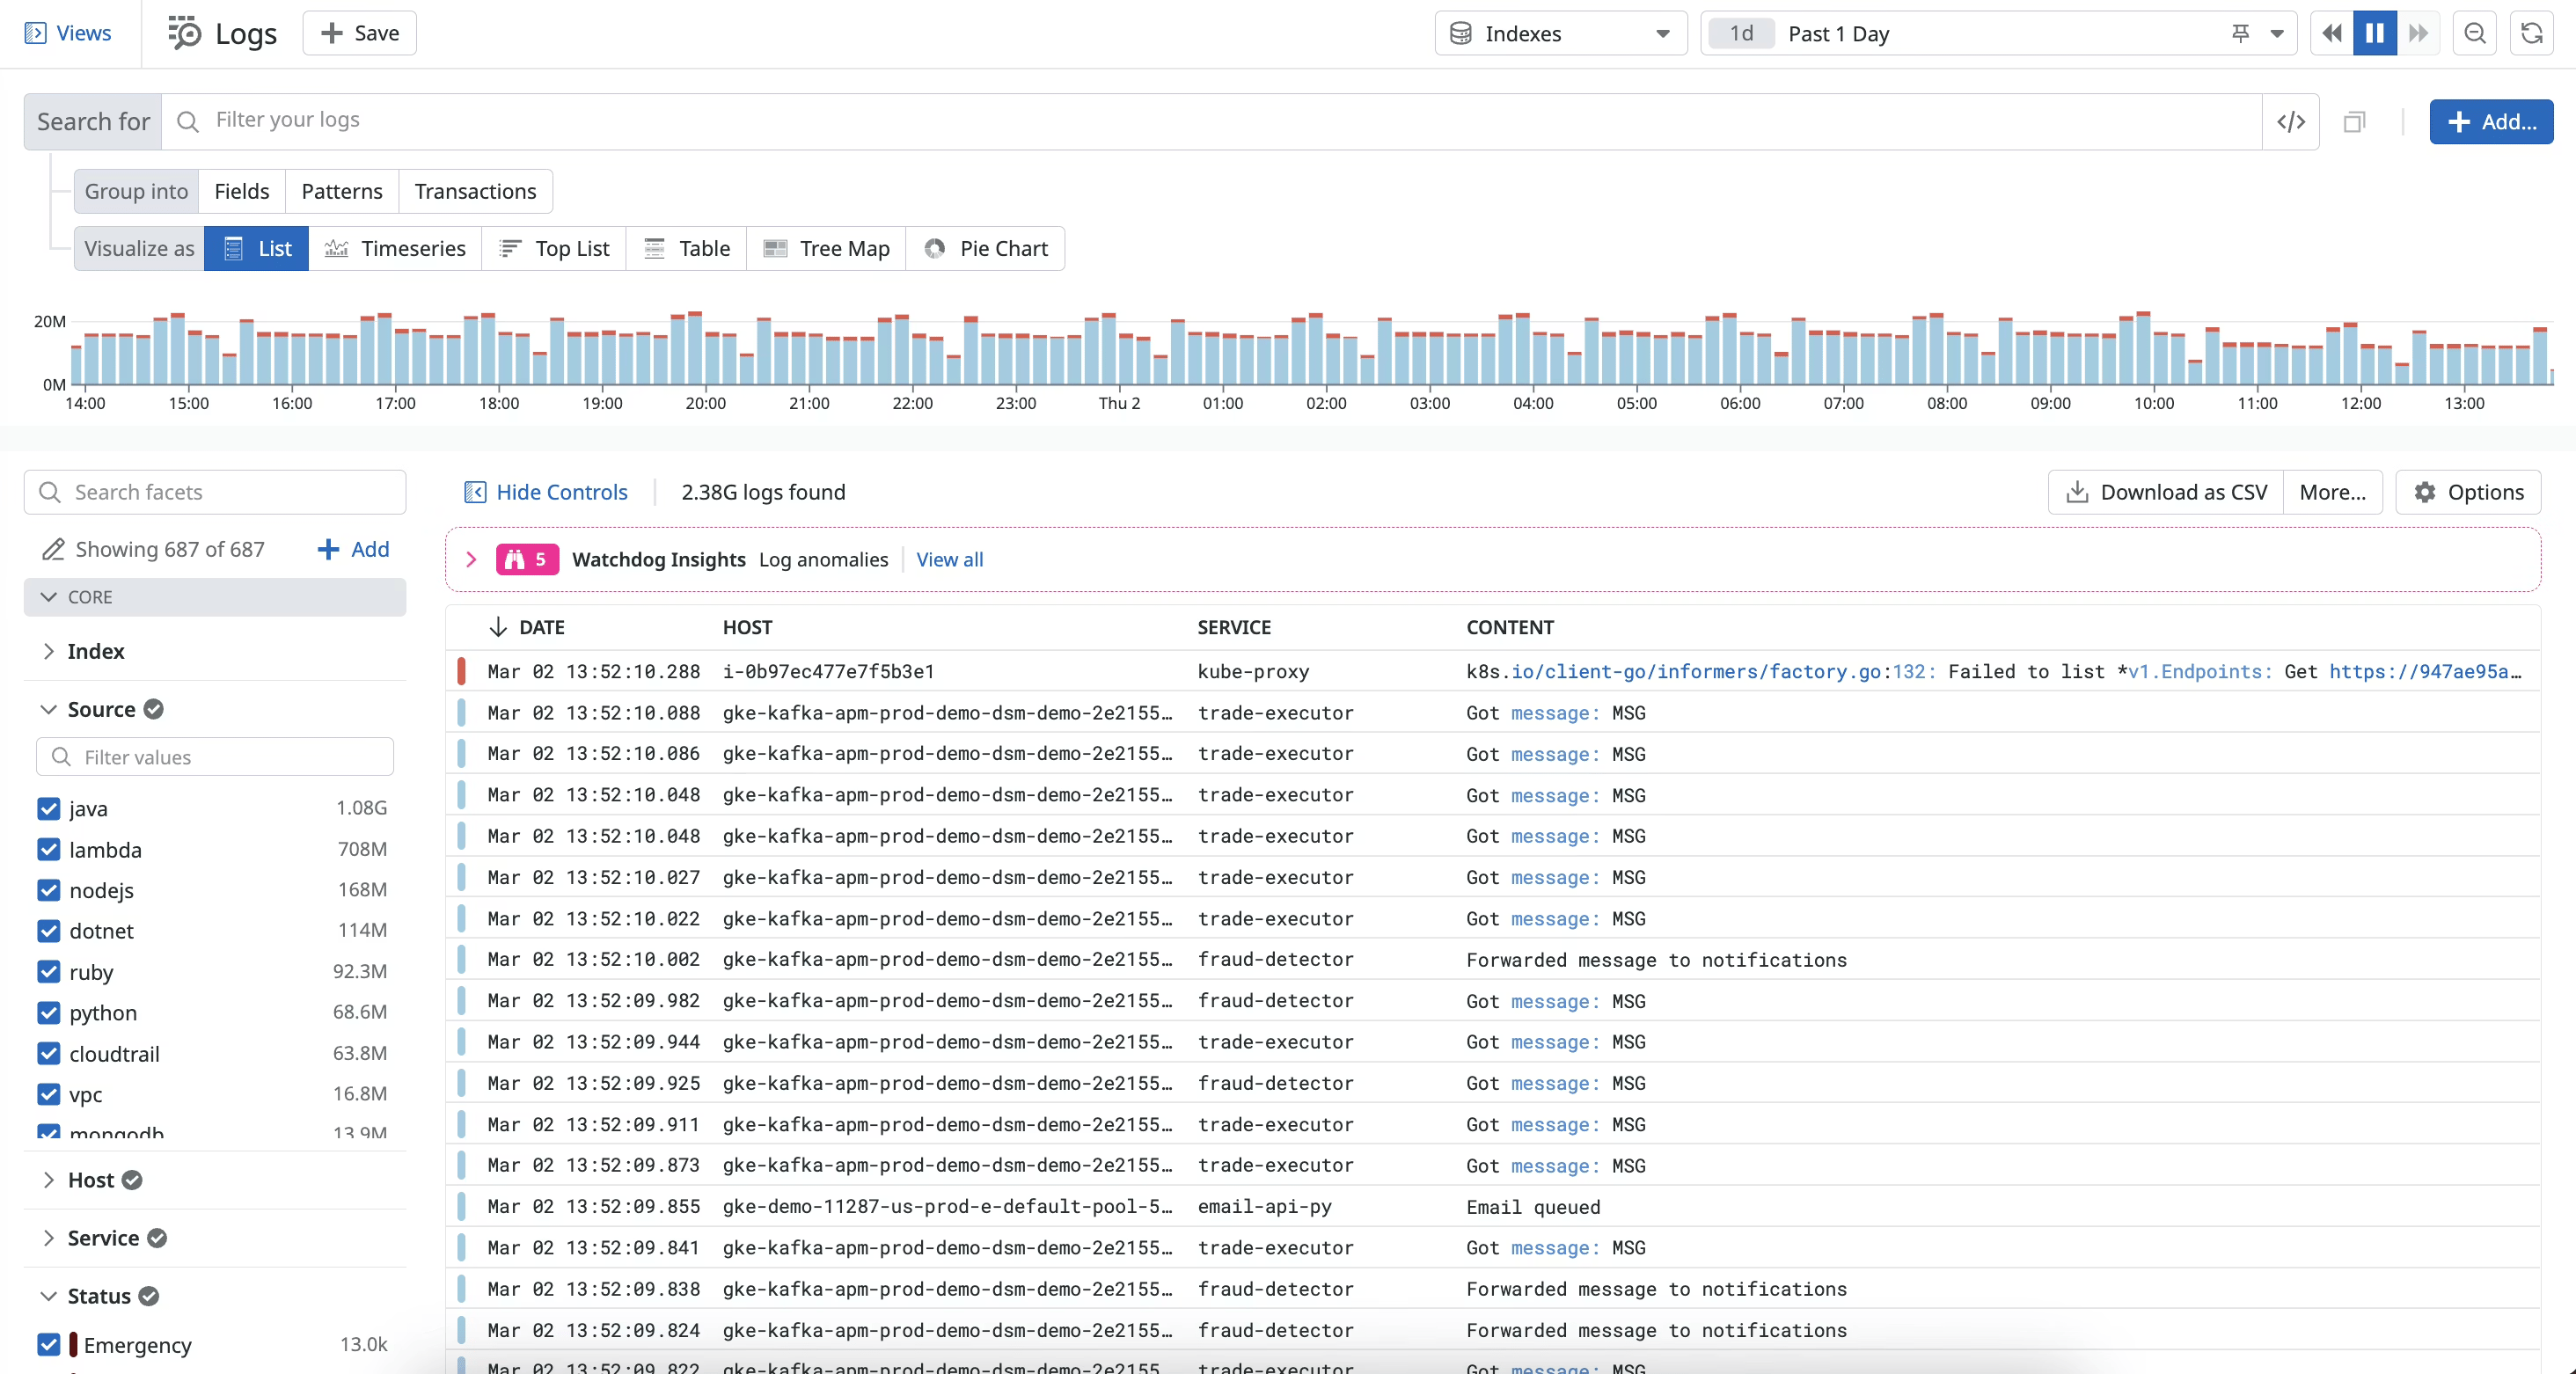
The query experience is genuinely strong: faceted search, Log Patterns clustering, Sensitive Data Scanner, and seamless trace correlation.
### Coralogix: in-stream log analytics with infinite retention in your bucket

Streama processes logs as they arrive, so alerts fire and anomaly detection runs before data touches any storage. For long-term retention, all data is compressed 5x and written to your S3 bucket at around $0.003 per GB effective cost. You query archive data directly from the Coralogix interface with DataPrime.
DataPrime handles deeply nested JSON, arrays, and mixed types without predefined schemas. Cross-telemetry joins let you query across logs, metrics, and traces in a single DataPrime expression. For compliance-driven organizations that need years of searchable log history without rehydration costs, the infinite retention model changes the economics significantly.
The routing decision is the tradeoff: data that only passed through the Monitoring pipeline is not available for ad-hoc queries. And DataPrime, while powerful, is proprietary. Every query your team builds is tied to the Coralogix platform. That is worth understanding clearly before committing.
| Log management | Datadog | Coralogix |
|---|---|---|
| Billing model | $0.10/GB ingestion + $1.70/million events indexed | Units-based ($0.42/GB Frequent Search, less for other tiers) |
| Searchability | Indexed subset only | Depends on tier routing |
| Infinite retention | No (rehydration required) | Yes (your S3 bucket) |
| Alert latency | Standard | Zero (in-stream) |
| Query language | Proprietary Log Search | DataPrime + Lucene |
| Data ownership | Datadog | You |
[summary]
### Log search with no indexing tax
Both Datadog and Coralogix have pricing structures that produce surprises at scale. Better Stack stores logs in a unified warehouse with SQL querying, no separate indexing layer, and no per-event charges. You pay for what you send, and all of it is searchable.
**Unified log management with SQL search, live tail, and no indexing surprises.** [See how it works.](https://betterstack.com/logs)
[/summary]
---
## Infrastructure monitoring and cloud metrics
Neither platform penalizes you for high-cardinality metrics with billing surcharges beyond the base model. The differences are in how infrastructure pricing is structured and what fleet management depth looks like.
### Datadog: comprehensive fleet visibility on a stacking per-host model

Datadog's infrastructure monitoring starts at $15/host/month on Pro and that is the foundation on which APM, database monitoring, and network monitoring all stack. Host maps visualize your fleet health. Kubernetes monitoring is deep. Network Performance Monitoring tracks service-to-service traffic flows. The high-water mark billing model means a five-day traffic spike can set your billing rate for the whole month.
### Coralogix: fleet management with cross-account Kubernetes visibility and no per-host fees

Coralogix's Infrastructure Explorer provides fleet management across accounts and regions, with relationship mapping that shows pod-to-node and service-to-volume connections for understanding blast radius during incidents. Historical metadata snapshots let you track infrastructure evolution over time. No per-host fees, no high-water mark billing, unlimited hosts included.
Metrics are priced at $0.05/GB in Coralogix's units model where 1 GB equals 1,000 time series. The 300,000 span metric cap requires monitoring for high-cardinality APM workloads but is not a billing surcharge.
| Infrastructure monitoring | Datadog | Coralogix |
|---|---|---|
| Pricing | Per-host ($15–$23/month) | Per GB/units (unlimited hosts) |
| High-water mark billing | Yes | No |
| Custom metric surcharges | Yes | No |
| Cross-account fleet management | Limited | Yes |
| Kubernetes depth | Yes (deep) | Yes (relationship mapping) |
| Network performance monitoring | Yes (NPM product) | Limited |
[summary]
### Infrastructure metrics connected to the full reliability workflow
Both Datadog and Coralogix charge for infrastructure telemetry in different ways. Better Stack takes a different approach: no per-host fees, no cardinality penalties, and infra metrics that live alongside uptime monitors, on-call schedules, and incident timelines.
**Infrastructure monitoring connected to alerting, on-call, and incident management, all in one place.** [Get started free.](https://betterstack.com)
[/summary]
---
## Digital experience monitoring
Both platforms offer mature digital experience suites with session replay, Core Web Vitals, and synthetic monitoring. Coralogix adds network-level visibility and deployment version tracking that Datadog does not match natively.
### Datadog: full digital experience suite with seamless backend correlation

Datadog covers Browser RUM, Mobile RUM across iOS, Android, React Native, and Flutter, Session Replay, Synthetic Monitoring, Product Analytics, and Experiments. The frontend-to-backend correlation is seamless because RUM and APM share the same backend. Each component is a separate line item.
### Coralogix: full-stack RUM with network monitoring and version tracking

Coralogix RUM captures browser and mobile sessions, Core Web Vitals, JavaScript errors, and session replay. Network monitoring shows every request from user device to backend, identifying whether latency is client-side, network-related, or server-side before you open a trace. Version tracking compares performance and error rates between deployment versions in real time, so a frontend release regression shows up in RUM data before user complaints accumulate.
RUM costs are included in Coralogix's units pricing rather than separate per-session SKUs.
| Digital experience | Datadog | Coralogix |
|---|---|---|
| Browser RUM | Yes | Yes |
| Mobile RUM | Yes (iOS, Android, React Native, Flutter) | Yes (iOS, Android) |
| Session replay | Yes | Yes |
| Synthetic monitoring | Yes | Yes |
| Network monitoring | No | Yes |
| Version tracking / comparison | Basic | Yes (deployment-aware) |
| Pricing | Per session + separate SKUs | Included in units |
---
## AI capabilities
Both platforms made major AI investments in 2025 and 2026. Coralogix's $200 million Series F in June 2026 was explicitly positioned around Olly and the transition toward agentic observability. The approaches are meaningfully different.
### Datadog Bits AI: autonomous investigation that fires without prompting

Datadog's Bits AI SRE went GA in December 2025. When an alert fires, it starts investigating immediately without waiting for anyone to prompt it: querying traces, reviewing logs, checking recent deployments, producing a hypothesis. By the time you open your laptop, the investigation is in progress. Beyond Bits AI SRE, there is Bits Chat for conversational queries, Bits Code for in-editor help, Bits Security Analyst for SIEM triage, and an MCP Server in Preview for Claude and Cursor integration.
### Coralogix Olly: multi-agent autonomous investigator with code-aware context and a full AI monitoring suite

Olly is not an AI assistant. Coralogix is explicit about this distinction: Olly is a multi-agent autonomous investigator that decides which data sources are relevant to a problem, executes queries across logs, metrics, and traces, and shows every step of its reasoning as it works. You initiate the investigation in natural language, and Olly operates autonomously from there. Connect a GitHub repository and Olly has code context for its analysis.
The MCP server is GA for all Coralogix customers and goes further than Datadog's Preview: it generates Terraform HCL and Kubernetes YAML from alert definitions, turning observability configuration into infrastructure as code. A programmable agentic CLI supports fully headless observability workflows for agent-driven automation without any dashboard interface.
The AI Center is where Coralogix has no direct equivalent from Datadog. If you run LLM agents in production, AI Discovery finds all AI agents across your organization. The Evaluation Engine scores every prompt and response for hallucinations, PII leaks, relevance, and toxicity in real time using small language model evaluators. AI Guardrails intercept or block unsafe outputs before they reach users. Cost tracking monitors spend per message, session, and agent. If agentic AI is a meaningful part of your production stack, this is purpose-built monitoring infrastructure that matters.
The trigger difference is real: Datadog's Bits AI SRE fires proactively the moment an alert triggers. Olly is initiated by you and then operates autonomously. Both are more capable than simple AI assistants, but the unprompted investigation start is Datadog's edge for 3am incidents.
| AI capability | Datadog | Coralogix |
|---|---|---|
| Autonomous investigation | Yes (Bits AI SRE, fires on alert) | Yes (Olly, initiated then autonomous) |
| Multi-agent reasoning | Limited | Yes (Olly, shows reasoning chain) |
| MCP server | Yes (Preview) | Yes (GA, all customers) |
| IaC generation from alerts | No | Yes (Terraform + K8s YAML) |
| Agentic CLI | No | Yes |
| AI agent monitoring (LLMs) | Limited | Yes (AI Center, full suite) |
| AI guardrails | No | Yes |
| AI Discovery | No | Yes |
| Code-aware investigation | Via MCP | Yes (GitHub repository integration) |
[summary]
### AI that also wakes someone up
Both Datadog and Coralogix have autonomous AI investigation. What neither one includes is a direct path from a root cause hypothesis to an on-call notification, an incident timeline, and a customer-facing status page update. Better Stack's AI SRE connects to the full incident lifecycle so the investigation and the response happen in the same place.
**Autonomous root cause investigation connected to on-call, incidents, and status pages.** [See the AI SRE.](https://betterstack.com)
[/summary]
---
## Incident management and alerting
Datadog is closer to a complete product here with Datadog On-Call. Coralogix's alerting quality is genuinely stronger for complex multi-signal conditions, but you need an external tool for on-call workflows.
### Datadog: seat-based incident management with On-Call
Datadog's incident management is a seat-based SKU covering incident declaration, responder assignment, timeline management, and Slack/Teams integration. On-call scheduling through Datadog On-Call or PagerDuty and OpsGenie integrations. Phone and SMS delivery requires external tools.
### Coralogix: sophisticated alerting, external tools for the paging layer

Coralogix's alerting fires from the Streama engine with zero indexing delay. ML-based anomaly detection adapts to normal behavior without manual threshold tuning. Flow alerts chain conditions across logs, metrics, traces, and security events in a visual drag-and-drop builder: trigger when a specific error pattern appears in logs within five minutes of an elevated latency reading in APM. Cases aggregate related alerts and route to Slack, PagerDuty, ServiceNow, or webhooks.
What is not included: on-call scheduling, phone and SMS delivery, escalation policies, or post-mortem generation. For five on-call engineers on PagerDuty, that adds $245 to $415 per month on top of the Coralogix contract.
| Incident management | Datadog | Coralogix |
|---|---|---|
| Native incident management | Yes (seat-based) | No (integrations only) |
| On-call scheduling | Via Datadog On-Call or external | Not included |
| Phone/SMS delivery | Via Datadog On-Call or external | Via PagerDuty/OpsGenie |
| ML anomaly detection | Watchdog (alert-driven) | Yes (adaptive, continuous) |
| Flow/composite alerts | Basic | Yes (drag-and-drop, cross-signal) |
| ServiceNow | Via integration | Yes (bidirectional, native) |
| Status pages | No | No |
---
## Pricing comparison
The cost comparison is directionally significant, but the actual numbers depend on how you use the TCO Optimizer and how much data goes to Frequent Search versus cheaper pipelines.
### Datadog: multidimensional billing that compounds with every product you add

Infrastructure at $15 to $23 per host per month, APM at $31 to $40 per host per month on top of that, log ingestion at $0.10/GB, log indexing at $1.70 per million events, custom metrics beyond the per-host allotment at $1 per 100. The high-water mark billing model means a traffic spike during your biggest week sets your billing rate for the full month.

A 100-host deployment with APM, logs, and RUM commonly runs $20,000 to $30,000 per month.
### Coralogix: units-based pricing with unlimited users, hosts, and all features included
Published rates: logs at $0.42/GB (Frequent Search), traces at $0.16/GB, metrics at $0.05/GB (1 GB equals 1,000 time series), AI evaluation at $1.50 per million tokens. All features, including RBAC, SSO, SIEM, Olly, and 24/7 human support, are included at every tier. Unlimited users and hosts.
You also pay S3 storage costs, but Coralogix compresses logs 5x before writing to your bucket, so the effective cost is around $0.003 per GB.
**Rough comparison: 100 hosts, 2.5TB/month telemetry**
| Cost component | Datadog (Pro, annual) | Coralogix |
|---|---|---|
| Infrastructure monitoring | $1,500/month | Included in units |
| APM | $3,100/month | Included in units |
| Log management | ~$3,600/month (ingestion + indexing) | ~$1,050/month at Frequent Search rate |
| Traces | Included in APM | ~$400/month |
| Metrics | Surcharges apply | ~$125/month |
| Users / hosts | Per plan | Unlimited |
| On-call (5 responders) | Datadog On-Call or PagerDuty | PagerDuty (~$245-415/month) |
| **Estimated monthly total** | **~$8,200+/month** | **~$1,820-2,235/month** |
The Coralogix figure assumes good TCO Optimizer usage. Teams that route most data to Frequent Search will see higher bills. S3 storage is additional. The directional difference is still significant.
| Pricing factor | Datadog | Coralogix |
|---|---|---|
| Per-host fee | Yes ($15–$23/month) | No |
| APM on top of infra | Yes ($31–$40/host) | No (included in units) |
| Unlimited users | No | Yes |
| Unlimited hosts | No | Yes |
| High-water mark billing | Yes | No |
| OTel metric surcharges | Yes | No |
| All features included | No (add-on model) | Yes |
| 24/7 human support included | Enterprise add-on | Yes |
| Data ownership | Datadog | You |
---
[summary]
### Enterprise observability without the multi-vendor model
Both Datadog and Coralogix require separate tools for status pages and on-call scheduling. Better Stack consolidates logs, metrics, traces, on-call scheduling, incident management, and status pages into one platform with one bill.
**Fewer vendors, fewer context switches, and a single place for the full reliability workflow.** [Talk to us.](https://betterstack.com)
[/summary]
---
## Security capabilities
Security is where the compliance gap between the platforms is most concrete.
### Datadog: Cloud SIEM and a full security platform woven into observability

Datadog has Cloud SIEM for threat detection across logs and cloud audit trails, Workload Protection for runtime kernel-level threat detection, App and API Protection against injection attacks, Code Security covering SAST, IAST, SCA, and secret scanning, Cloud Security Posture Management, and Vulnerability Management. The integration between security signals and observability data is Datadog's core differentiator: a security alert and the APM trace that triggered it live in the same system.
Datadog holds SOC 2 Type II, GDPR, and HIPAA. PCI DSS and ISO 27001 are not in the standard compliance portfolio.
### Coralogix: full SIEM with MDR and the broadest compliance portfolio

Coralogix runs a full SIEM on its Streama engine with 2,500+ out-of-the-box detection rules, 400+ security integrations, ML-based threat detection with zero indexing delay, and infinite retention for security logs in your own bucket. Managed Detection and Response is available through Snowbit.io for organizations without a dedicated SOC team.
The compliance portfolio covers SOC 2, PCI DSS, ISO 27001, GDPR, HIPAA, and FCA. For financial services, healthcare, or any industry where PCI DSS or FCA compliance is a procurement requirement, this breadth is often determinative.
| Security | Datadog | Coralogix |
|---|---|---|
| Cloud SIEM | Yes | Yes (2,500+ rules, in-stream) |
| MDR | No | Yes (via Snowbit.io) |
| Workload protection (runtime) | Yes | No |
| Code security (SAST/IAST/SCA) | Yes | No |
| SOC 2 Type II | Yes | Yes |
| HIPAA | Yes | Yes |
| PCI DSS | No | Yes |
| ISO 27001 | No | Yes |
| FCA | No | Yes |
| FedRAMP | Yes (GovCloud) | Yes (GovCloud region) |
---
## What each platform genuinely lacks
**Datadog gaps worth knowing:**
- No free tier
- No self-hosted option; all telemetry lives in Datadog's infrastructure permanently
- High-water mark billing can move your invoice unexpectedly from traffic spikes
- OpenTelemetry metrics charged as custom metrics
- No status pages
- No PCI DSS or ISO 27001 compliance
- No AI agent monitoring for production LLM applications
- No customer-owned data storage
**Coralogix gaps worth knowing:**
- No on-call scheduling, escalation policies, or phone/SMS delivery
- No status pages
- DataPrime is proprietary; every query and dashboard your team builds is tied to the Coralogix platform
- Tier routing via TCO Optimizer requires upfront decisions that can go wrong during incidents
- 300K span metric cap requires monitoring for high-cardinality APM workloads
- No Datadog-equivalent workload protection or code security
- Bits AI SRE fires proactively at alert time; Olly requires you to initiate the investigation first
- Setup and post-deploy configuration is more involved than Datadog's agent install
---
## Final thoughts
A few questions will settle this comparison faster than reading any feature table.
Do you need your data in your own cloud account? Coralogix is built for that from the ground up. Datadog is not an option if data sovereignty is a hard requirement.
Do you need PCI DSS, ISO 27001, or FCA compliance? Those certifications are standard in Coralogix and absent from Datadog's default portfolio. In financial services and regulated industries, this is often a procurement gate rather than a preference.
Do you run LLM agents in production and need to monitor, evaluate, and guard them? Coralogix's AI Center is purpose-built for that. Datadog does not have an equivalent today.
**If none of those apply and your primary need is the smoothest possible investigation experience for an engineering or SRE team, Datadog's case is real.** The single-view investigation where you click from alert to trace to logs to infrastructure metrics without configuration is genuinely good. Bits AI SRE fires the moment an alert triggers, before you even open your laptop. You pay significantly more for it, and the bill can move unexpectedly from traffic spikes and product additions. But for teams where that workflow quality is the deciding factor, understanding the cost clearly before choosing on price alone is the right approach.
**If data sovereignty, compliance, predictable pricing, or production AI observability are your priorities, Coralogix offers a meaningfully different platform.** Its combination of customer-owned storage, broader compliance coverage, units-based pricing with unlimited users and hosts, and a multi-agent AI investigator built specifically for the agentic era makes it a compelling alternative.
[summary]
### One thing neither covers: the full reliability layer
Neither Datadog nor Coralogix includes uptime monitoring, unlimited phone/SMS on-call alerting, incident management, and customer-facing status pages in a unified product. Better Stack brings all of that together with logs, metrics, and traces, with usage-based pricing and no per-host fees.
**The full reliability lifecycle in one place. Start free, no credit card required.** [Try Better Stack.](https://betterstack.com)
[/summary]