# Better Stack vs Uptime.com: A Complete Comparison for 2026
If you're putting together a shortlist for uptime monitoring, **Better Stack and Uptime.com will probably both show up.** On the surface that makes sense: both watch your URLs, both send alerts, both have status pages. But spend more than five minutes with each and you'll notice **they're built around completely different assumptions** about what you actually need.
**Uptime.com is a mature, purpose-built external monitoring platform.** It's genuinely good at answering one question: **is this endpoint reachable from these locations right now?** It covers that ground with a clean interface and a wide range of check types, and a lot of people use it happily for exactly that purpose.
**Better Stack takes a different approach.** Uptime monitoring is part of a **broader observability platform** that also handles log management, infrastructure metrics, distributed tracing, error tracking, real user monitoring, and incident management. When a check fails, you're not just getting an alert. You're getting **the application logs, the metric anomalies, and the backend traces from that moment**, all in the same interface. The question it answers is not just **"is your site down?"** but **"why is it down, and what do you do about it?"**
This comparison covers both platforms honestly. **Where Uptime.com has a genuine edge, this article says so.** The goal is to give you enough to **make the right call for your situation.**
## Quick comparison at a glance
| Category | Better Stack | Uptime.com |
|----------|-------------|------------|
| **Primary Focus** | Full-stack observability platform | External uptime monitoring |
| **Uptime/Synthetic Monitoring** | Yes (HTTP, SSL, API, heartbeat) | Yes (30+ check types, global network) |
| **Log Management** | Yes (unified, SQL-queryable) | No |
| **Metrics/Infrastructure** | Yes (Prometheus-compatible, PromQL) | No |
| **Distributed Tracing/APM** | Yes (eBPF, zero-code) | No |
| **Error Tracking** | Yes (Sentry-compatible) | No |
| **Real User Monitoring** | Yes (session replay, web vitals) | Yes (basic RUM add-on) |
| **Incident Management** | Yes (on-call, escalation, post-mortems) | Alerting + escalations (no full incident workflow) |
| **Status Pages** | Yes (multi-channel, automatic sync) | Yes (strong feature set) |
| **AI SRE / MCP** | Yes (AI SRE + GA MCP server) | No |
| **Probe Network** | Multiple global regions | 100+ probe servers worldwide |
| **Pricing Model** | Data volume + responders | Per-check-tier (modular add-ons) |
| **Starting Price** | $0 (free tier available) | $7/month (Website Monitoring) |
| **Enterprise Features** | SSO, SCIM, RBAC, audit logs, data residency | SSO available on all plans |
## Platform architecture
The most useful thing you can know about these two products is what they don't share. Uptime.com is designed around one question: is this endpoint reachable from these locations? Better Stack is designed around a different one: what's actually happening across your system, and what caused this alert to fire?
### Better Stack: observability platform with uptime monitoring included
Better Stack's architecture puts logs, metrics, traces, and uptime monitoring into a single data warehouse with one query interface across all of it. The eBPF-based collector runs at the kernel level, capturing telemetry without requiring code changes in your services. Uptime monitoring isn't bolted on top of this infrastructure. It's built into the same foundation.
When a Better Stack uptime alert fires, the investigation context is already there. You don't need to open another tab or switch products to find your logs from the affected service. The metric anomalies, the active traces, and the check failure all sit in the same interface. That difference matters most when you're dealing with an incident at 3am and you need to go from "site is down" to "here is what broke" as fast as possible.
**Query everything with SQL or PromQL.** Logs, metrics, uptime check results, and error counts all live in the same warehouse. When a transaction check fails, you can pull the associated application logs with a single SQL query rather than opening a separate log management tool.
**OpenTelemetry-native.** Better Stack treats OTel as a first-class citizen. Your data is in open formats, so you're not locked in, and if your requirements change, you change a configuration line rather than re-instrumenting your codebase.

### Uptime.com: purpose-built external monitoring
Uptime.com monitors from the outside in. Its probe network checks your URLs, APIs, TCP ports, SSL certificates, DNS records, and synthetic transaction flows from 100+ locations worldwide. The platform is specifically built for external availability monitoring, and that focus shows in how many check types it supports: 15+ basic types plus API monitoring, transaction monitoring, page speed, webhook monitoring, heartbeat checks, and cloud status monitoring.
What Uptime.com doesn't do is give you visibility into what's happening inside your application. When a check fails, you'll know which endpoint stopped responding and from which probe location. Finding out why requires you to open your log management tool, check your APM, and review your infrastructure metrics separately. Uptime.com provides the alarm. The investigation happens elsewhere.
That's not a knock against it. It's just a meaningful distinction if you're deciding whether external monitoring is sufficient for your situation or whether you need to connect availability data to what's happening inside the application.

| Architecture aspect | Better Stack | Uptime.com |
|--------------------|--------------|------------|
| **Monitoring scope** | External + internal (logs, metrics, traces) | External availability only |
| **Data collection** | eBPF collector + active checks | External probe network (100+ locations) |
| **Storage model** | Unified warehouse (all telemetry together) | Check results + RUM separately |
| **Query language** | SQL + PromQL (all data) | Dashboard/reporting UI |
| **Investigation workflow** | Single interface from alert to root cause | Alert to external tool handoff |
| **OpenTelemetry support** | Native, first-class | Not applicable |
| **Check types** | HTTP, API, SSL, heartbeat, plus full APM/logs | 30+ check types (HTTP through cloud status) |
## Pricing comparison
These two platforms price very differently, and that matters when you're estimating total cost of ownership. Better Stack charges by data volume: you pay for GB ingested and stored, plus a per-responder fee for incident management. Uptime.com charges by check tier: you pay for a bundle of basic and advanced check slots, with RUM and status pages as separate add-on modules.
### Better Stack: volume-based pricing
Better Stack charges based on how much data you send, not how many hosts you have or which feature modules you activate. The pricing formula is simple: data volume plus responders plus monitors.
**Pricing structure:**
- Logs: $0.10/GB ingestion + $0.05/GB/month retention (100% searchable)
- Traces: $0.10/GB ingestion + $0.05/GB/month retention
- Metrics: $0.50/GB/month (no cardinality penalties)
- Error tracking: $0.000050 per exception
- Responders: $29/month (unlimited phone/SMS)
- Monitors: $0.21/month each
- RUM: $0.00150/session replay; web events volume-based
There are no per-host charges, no cardinality penalties, and no module licensing fees. Costs grow in line with actual usage. Uptime monitoring is included in the platform, so you're not paying a separate line item to add HTTP checks on top of your log management subscription.
### Uptime.com: modular check-tier pricing
Uptime.com's pricing is built around check quotas. Each plan tier bundles a number of basic checks and advanced checks, and the real cost depends on how many of each type you need and which add-on modules you want alongside.
**Published pricing (monthly, from the pricing page):**
- Website Monitoring: starts at $7/month (10 basic checks, 1 advanced check, 25 SMS alerts)
- Real User Monitoring: starts at $5/month (separate module)
- Status Pages: starts at $19/month (separate module)
- Annual plans save approximately 20%
The starting price doesn't go far for meaningful deployments. Transaction monitoring, API checks, and page speed checks are all advanced check types, and advanced check quotas are limited at entry tiers. Third-party sources including TrustRadius and Capterra report standard plans ranging from roughly $24 to $455/month depending on check volume and add-ons. Enterprise pricing is negotiated directly.
G2 and Capterra reviewers consistently call Uptime.com pricing fair relative to what it does, especially compared to more expensive alternatives like Catchpoint or Pingdom. The complaint that comes up most often is that costs accumulate once you start adding modules.
### Cost comparison: 3-year TCO
For comprehensive monitoring coverage including uptime checks, log management, metrics, error tracking, incident management, and status pages:
| Category | Better Stack | Uptime.com |
|----------|-------------|------------|
| Uptime monitoring | Included | ~$84-1,800/yr (depends on checks needed) |
| Log management | ~$3,600/yr (30GB/mo) | Not available (separate tool required) |
| Metrics/infrastructure | ~$1,800/yr | Not available (separate tool required) |
| Error tracking | ~$3,600/yr | Not available (separate tool required) |
| Incident management | ~$1,740/yr (5 responders) | Alerting only (no full incident workflow) |
| Status pages | Included | ~$228-2,496/yr (add-on module) |
| APM/Tracing | Included | Not available (separate tool required) |
| **3-year total (platform)** | **~$32,220** | **~$1,500 + external tool costs** |
This comparison breaks down if you only need external uptime monitoring. If that's your actual situation, Uptime.com at $84/year is a clear win. The math shifts when you factor in the other tools you'd need to fill Uptime.com's gaps: a log management platform, an APM tool, an error tracker, and an incident management system running alongside it.
## Website monitoring and synthetic monitoring
This is Uptime.com's home turf, and it's genuinely strong here. Better Stack covers external monitoring well, but Uptime.com's check type breadth and probe network maturity represent a real competitive advantage worth acknowledging.
### Better Stack: uptime monitoring built into the platform
Better Stack's uptime monitors cover HTTP/HTTPS endpoints, API responses, SSL certificate expiry, domain health, and heartbeat (cron job) completion. Checks run from multiple global regions with configurable intervals and multi-location confirmation to cut false positives. When a check fails, it routes directly into Better Stack's incident management workflow.
Because uptime monitoring lives inside the same platform as logs, metrics, and traces, a failed check immediately surfaces correlated log activity from the affected service. When Better Stack detects your checkout API returning 503s from three probe locations, the associated application logs and error spike are visible without opening a second tool. You don't need to correlate anything manually. It's already connected.
**Integrations:** 100+ covering all major stacks: MCP, OpenTelemetry, Vector, Prometheus, Kubernetes, Docker, PostgreSQL, MySQL, Redis, MongoDB, Nginx, and more.
Watch how Better Stack monitors work in practice:
### Uptime.com: the dedicated uptime specialist
Uptime.com offers over 30 check types, which is broader than most competitors at this price point. Basic monitoring covers SSL/certificate expiry, HTTPS, DNS, WHOIS/domain, SMTP, POP, IMAP, UDP, malware/virus scanning, SSH, NTP, domain blacklist, TCP port, ping, and FTP/SFTP. Advanced monitoring adds API monitoring, transaction monitoring with TOTP support for 2FA flows, micro-transactions, extended transactions, page speed, webhook monitoring, heartbeat/cron monitoring, cloud status monitoring, and group checks.
Transaction monitoring is one of Uptime.com's real differentiators at this tier. The transaction recorder lets you define multi-step user journeys in a Chromium browser environment without scripting. Login flows, checkout sequences, form submissions: you record them once and they run on schedule from Uptime.com's probe network. Screenshots on failure show you exactly which step broke. TOTP support means even 2FA-protected flows can be tested, which isn't something most tools at this price point offer.
Private location monitoring lets you run the same check types from behind your own firewall, covering internal services and intranet applications that a public probe network simply can't reach. This feature is available across all plans, not locked behind enterprise tiers.
The 100+ probe servers give you IPv4 and IPv6 coverage worldwide. You can configure custom secret headers to differentiate probe traffic from real user traffic in your logs, and you can target checks geographically so you're monitoring from regions where your users actually are.
Where Uptime.com hits its ceiling: the platform won't show you what's happening inside your application when a check fails. Root cause analysis means "which step in the transaction failed and what did the browser see at that point." It doesn't mean "here are the application logs, here's the database query that timed out, here's the trace that shows which service call broke." That's not a design flaw. It's just outside the scope of what the product is trying to do.
G2 reviewers mention the transaction recorder as occasionally tricky for complex flows. One reviewer noted the login test wizard doesn't always produce accurate results. Another flagged occasional alert delays. These are the rough edges of a mature product that's still being improved, not fundamental reliability issues.

| Monitoring feature | Better Stack | Uptime.com |
|-------------------|--------------|------------|
| **HTTP/HTTPS checks** | Yes | Yes |
| **SSL certificate monitoring** | Yes | Yes |
| **DNS monitoring** | Yes | Yes |
| **API monitoring** | Yes | Yes |
| **Transaction/synthetic** | Yes | Yes (with transaction recorder) |
| **TOTP/2FA testing** | No | Yes |
| **Page speed monitoring** | Via RUM (Core Web Vitals) | Yes (dedicated check type) |
| **Heartbeat/cron monitoring** | Yes | Yes |
| **Webhook monitoring** | Yes | Yes |
| **Private location monitoring** | Via collector (internal services) | Yes (dedicated private locations) |
| **Probe network** | Multiple global regions | 100+ probe servers worldwide |
| **Cloud status monitoring** | No | Yes (third-party status page monitoring) |
| **Root cause correlation** | Automatic (logs + metrics + traces) | External tool required |
| **False-positive reduction** | Multi-location confirmation | Multi-location confirmation |
## Log management
This section has a clear answer. Uptime.com doesn't have log management. If you're deciding whether to add log management to your monitoring stack, the real choice is between getting it as part of Better Stack or sourcing it separately from something like Papertrail, Loggly, or Elastic.
### Better Stack: unified log management
[Better Stack logs](https://betterstack.com/logs) ingests, stores, and makes 100% of your logs immediately searchable via SQL or PromQL. There are no indexing fees, no decisions about which logs to make searchable, and no cold storage tier that becomes unavailable right when you need it most.
You can query your logs with standard SQL:
```sql
SELECT
service_name,
COUNT(*) as error_count,
AVG(duration_ms) as avg_duration
FROM logs
WHERE level = 'error'
AND timestamp > NOW() - INTERVAL '1 hour'
GROUP BY service_name
ORDER BY error_count DESC
```
**Pricing:** $0.10/GB ingestion + $0.05/GB/month retention. A service generating 100GB monthly costs $15 total. That same volume in a standalone log management tool typically costs multiples of that before you factor in indexing fees.
Live Tail gives you real-time log streaming with filtering. Presets let you save common queries so you're not rebuilding your searches from scratch every time you need them.
### Uptime.com: no log management
Uptime.com is not a log management platform. If you use Uptime.com for external monitoring, you'll need a separate solution for application logs. That means an additional product, another login, another cost, and another tool to switch to every time an uptime alert fires and you need to understand what happened.
| Log management | Better Stack | Uptime.com |
|---------------|--------------|------------|
| **Log ingestion** | Yes ($0.10/GB) | No |
| **Searchability** | 100% of ingested logs | N/A |
| **Query language** | SQL + PromQL | N/A |
| **Live tail** | Yes | No |
| **Trace correlation** | Automatic | N/A |
| **Retention** | Configurable ($0.05/GB/month) | N/A |
## Synthetic monitoring and API monitoring
Both platforms cover API monitoring, but at very different depths. This section focuses specifically on the API and synthetic monitoring capabilities, separate from the broader external check portfolio covered above.
### Better Stack: API monitoring with backend correlation
Better Stack's API monitors check endpoints for response codes, response time, and body content on configurable intervals. When an API check fails, the alert context includes the associated service's log activity and any active traces from the period of the failure. If your API is returning 500s because of a database timeout, the trace and the corresponding query log are right there alongside the alert. You don't need to go looking for them.
The eBPF-based APM component also automatically captures HTTP/gRPC traffic between your internal microservices without SDK installation. That gives you distributed trace visibility that a purely external checker can't match: not just "your API endpoint is failing" but "your API is failing because this internal service call is timing out at this specific step."
### Uptime.com: API monitoring with assertion chains
Uptime.com's API monitoring supports multi-step API chains with assertions at each step. You can define sequences of API calls where the response from one call populates parameters in the next, for example extracting a token from a login response and using it in subsequent authenticated requests. That's a meaningful feature if you need to validate realistic API workflows rather than just single-endpoint availability.
Response body validation, header checking, and JSON path assertions give you flexibility in defining what "healthy" actually means for a given API. All of this runs from Uptime.com's global probe network, so you're getting external validation from real network paths.
What Uptime.com's API monitoring can't show you is what's happening on your backend when an API call fails. You'll know which call failed, what response code came back, and how long it took. Getting from that to a root cause requires a separate tool.

| API monitoring | Better Stack | Uptime.com |
|---------------|--------------|------------|
| **Multi-step API chains** | Yes | Yes (with response chaining) |
| **Response assertions** | Yes | Yes (body, headers, JSON path) |
| **Authentication support** | Yes | Yes (including bearer tokens) |
| **Global probe validation** | Yes | Yes (100+ probe locations) |
| **Backend trace correlation** | Yes (automatic via eBPF) | No |
| **Log correlation on failure** | Yes (automatic) | No (external tool required) |
| **TOTP/MFA testing** | No | Yes |
## Infrastructure monitoring and metrics
Uptime.com doesn't monitor infrastructure. It doesn't collect host metrics, container stats, or Kubernetes resource utilization. This section is mostly describing a Better Stack capability that Uptime.com doesn't have, which matters if you're evaluating whether to consolidate your tooling.
### Better Stack: infrastructure monitoring with no cardinality penalties
[Better Stack metrics](https://betterstack.com/infrastructure-monitoring) is Prometheus-compatible, supporting full PromQL queries. Pricing is based on data volume rather than unique metric combinations, so you can add high-cardinality tags like customer IDs, deployment versions, or feature flags without worrying about bill explosions.
If you're already running Prometheus, your existing exporters and dashboards work without reconfiguration:
If you'd rather not write queries at all, there's also a drag-and-drop chart builder:
CPU usage, memory consumption, disk I/O, network throughput, Kubernetes pod restarts, container resource limits: all of it is visible in the same interface as your uptime checks and logs. When an uptime alert fires and the logs don't immediately reveal the cause, one more click tells you whether the host running that service is sitting at 99% CPU.
### Uptime.com: no infrastructure monitoring
Uptime.com monitors external availability. Host metrics, container stats, and infrastructure resource utilization are outside its scope entirely. If you use Uptime.com as your primary monitoring platform, you'll typically run a separate infrastructure monitoring tool alongside it, whether that's Prometheus, Datadog, Grafana Cloud, or Zabbix.
| Infrastructure monitoring | Better Stack | Uptime.com |
|--------------------------|--------------|------------|
| **Host metrics** | Yes | No |
| **Container monitoring** | Yes (Kubernetes, Docker) | No |
| **PromQL support** | Yes | No |
| **Cardinality penalties** | None | N/A |
| **Dashboards** | SQL + PromQL + drag-and-drop | N/A |
## Application performance monitoring
Better Stack includes eBPF-based distributed tracing. Uptime.com doesn't include APM. Again, this is mainly describing a Better Stack capability that shapes how you'd need to use these two products together.
### Better Stack: eBPF-based APM
[Better Stack's APM](https://betterstack.com/tracing) captures distributed traces at the kernel level without requiring SDK installation or code changes in your services. Deploy the collector, and HTTP/gRPC traffic between your services becomes visible immediately.
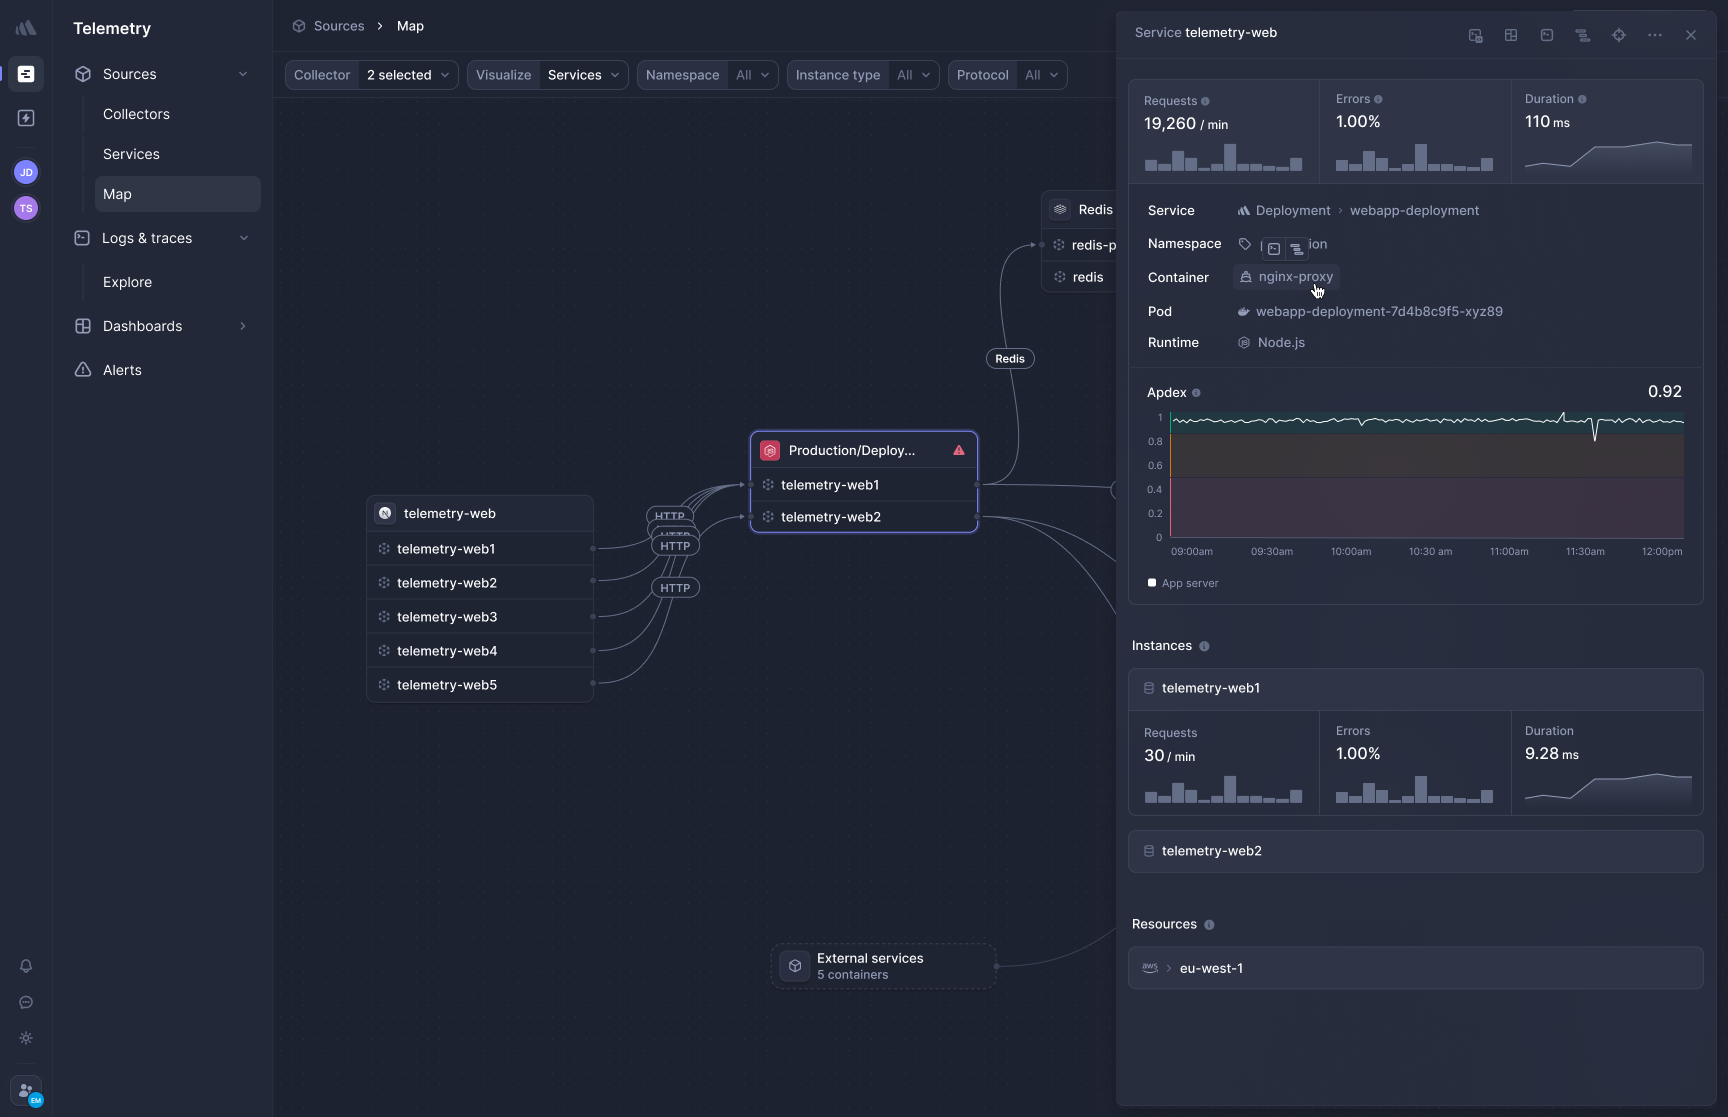
**Frontend-to-backend correlation** links browser sessions to backend service calls in a single view. When a page load is slow, you can trace it from the user's browser through your microservices and database queries without switching products.
**OpenTelemetry-native, zero lock-in.** Your traces are in OTel format and they're portable. If your requirements change, you change a config line, not your codebase. There are no proprietary agents and no migration tax.
Database calls to PostgreSQL, MySQL, Redis, and MongoDB are traced automatically. In polyglot environments with Python, Go, Ruby, Java, and Node.js running side by side, the eBPF approach eliminates the per-language SDK management overhead that agent-based APM tools require.
| APM | Better Stack | Uptime.com |
|-----|--------------|------------|
| **Distributed tracing** | Yes (eBPF, zero-code) | No |
| **Database query tracing** | Yes (automatic) | No |
| **Frontend-to-backend** | Yes (unified interface) | No |
| **OpenTelemetry** | Native | N/A |
| **Service maps** | Yes | No |
| **Code-level profiling** | Network-level only | N/A |
## Incident management
This one is more nuanced than the sections above. Uptime.com has alerting, escalations, and integrations with notification channels. What it doesn't have is incident lifecycle management, on-call scheduling with rotation support, post-mortems, or dedicated incident channels. Better Stack includes all of that.
### Better Stack: full incident lifecycle
[Better Stack incident management](https://betterstack.com/incident-management) covers the complete workflow from alert to resolution to post-mortem.
On-call scheduling with rotation management, timezone-aware handoffs, and escalation policies handles 24/7 coverage without requiring a separate PagerDuty or OpsGenie subscription:
Slack-native incident channels create a dedicated workspace per incident with investigation tools built in, so you can work through the incident without leaving Slack:
Post-mortems are generated automatically from incident timelines:
**Pricing:** $29/month per responder, including unlimited phone and SMS alerts. For five responders, that's $145/month with no additional tools required.
### Uptime.com: alerting and escalations

Uptime.com's alerting covers 20+ integrations including Slack, PagerDuty, OpsGenie, webhooks, email, SMS, and phone. You can configure multi-tier escalation rules based on time-of-day and alert type, and SMS alerts are bundled into plans starting with 25 at the entry tier.
What it doesn't offer is on-call rotation scheduling, dedicated incident channels with collaborative tools, incident lifecycle tracking from declare through resolve through post-mortem, or automatic post-mortem generation. These aren't surprising gaps for a product whose primary job is external availability checking. But they do mean that if you need a full incident workflow, you'll be integrating Uptime.com with PagerDuty ($49-83/user/month) or OpsGenie and adding another tool and another bill to the stack. Better Stack collapses both into one.
| Incident management | Better Stack | Uptime.com |
|--------------------|--------------|------------|
| **Alerting channels** | 20+ (Slack, Teams, PagerDuty, etc.) | 20+ integrations |
| **Phone/SMS alerts** | Unlimited ($29/responder/month) | Bundled SMS (volume by plan) |
| **On-call scheduling** | Yes (rotations, timezone-aware) | No |
| **Escalation policies** | Yes (multi-tier, time-based) | Yes (basic escalations) |
| **Incident channels (Slack)** | Yes (dedicated per incident) | Integration only |
| **Incident lifecycle tracking** | Yes (declare to resolve to post-mortem) | No |
| **Post-mortems** | Automatic from timeline | No |
| **Monthly cost (5 responders)** | $145 (all-in) | Alerting only + PagerDuty/OpsGenie if needed |
## Real user monitoring
Both platforms offer RUM, but at different depths. Better Stack's RUM integrates with the full platform so logs, traces, and error tracking are all in the same interface. Uptime.com's RUM is a lightweight add-on focused on performance baselines and error identification.
### Better Stack: unified RUM

Better Stack RUM captures frontend sessions, JavaScript errors, Core Web Vitals (LCP, CLS, INP), user behavior analytics, and session replays. Because it lives in the same data warehouse as your backend telemetry, a session replay links directly to the backend trace and the JavaScript error from the same user journey. There's no cross-product correlation to configure. It's already connected.
Session replay filters by rage clicks, dead clicks, and error signals. Sensitive fields are excluded at the SDK level so PII stays out of recordings. Playback runs at 2x speed with dead-time skipping so you're watching the signal, not sitting through dead air.
Website analytics tracks referrers, UTM campaigns, entry and exit pages, and locale data in real time. If you're seeing a traffic spike, you can check whether it came from a marketing campaign or a ChatGPT mention and correlate it with backend load in the same interface.
**Product analytics** with auto-captured user events means you can define funnel analysis after the fact. You don't need to pre-instrument events before you know what questions you'll want to ask.
For 5M web events and 50,000 session replays per month, Better Stack comes in at approximately $102.
### Uptime.com: RUM as a lightweight add-on
Uptime.com's RUM module starts at $5/month and tracks page load performance, user behavior metrics, and error identification. It supports unlimited sites and users, provides performance baselines, shareable reports, and 13 months of data retention.
What it doesn't include is session replay, funnel analysis, product analytics, or any connection to backend application telemetry. It's a performance measurement tool rather than a full user experience debugging platform. If you need session replay and backend trace correlation, you'll need a separate product like FullStory, LogRocket, or PostHog alongside Uptime.com.

| RUM feature | Better Stack | Uptime.com |
|-------------|--------------|------------|
| **Core Web Vitals** | Yes (LCP, CLS, INP) | Yes |
| **Session replay** | Yes | No |
| **Error tracking integration** | Yes (built-in, linked to replays) | Basic error identification |
| **Backend trace correlation** | Yes (unified interface) | No |
| **Funnel analysis** | Yes | No |
| **Product analytics** | Yes | No |
| **Data retention** | Configurable | 13 months |
| **Starting price** | Volume-based (~$102 for 5M events + 50K replays) | $5/month (separate module) |
## Status pages and customer communication
Both platforms have genuine status page products. This is actually one of the stronger areas in the Uptime.com comparison, with a feature set that competes well with Better Stack's.
### Better Stack: built-in status pages with multi-channel notifications
[Better Stack Status Pages](https://betterstack.com/status-page) automatically syncs with incident management. When you declare an incident, the status page updates without a separate manual step.
Subscriber notifications go out via email, SMS, Slack, and webhook. Subscribers can opt into specific components so they're only notified about the services they care about. Password protection, SSO/SAML login, and IP allowlisting give you private pages for internal audiences. Custom CSS means your design team has full visual control over how the page looks.
**Pricing:** $12-208/month for advanced features, included as part of Better Stack's platform at no additional license fee.
### Uptime.com: strong native status pages
Uptime.com's status pages are a genuine strength of the platform, not an afterthought. Public and private pages support component hierarchy with four impact levels (operational, degraded performance, partial outage, major outage), custom subdomain support at status.yourcompany.com, maintenance window announcements, and an embeddable system status notice you can drop into your own product to show availability at a glance.
Google Analytics pixel integration, Google Search opt-out for private pages, and customizable design give you good control over how the page presents. Email subscriber management supports double opt-in and bulk import.
The gap versus Better Stack is subscriber notifications. Uptime.com status pages notify subscribers by email only. There's no SMS or Slack notification channel for external subscribers. For customer-facing communication during an incident, that's a meaningful limitation compared to Better Stack's multi-channel approach.

| Status pages | Better Stack | Uptime.com |
|--------------|--------------|------------|
| **Public pages** | Yes | Yes |
| **Private pages** | Yes (password, SSO, IP allowlist) | Yes (password-protected) |
| **Incident auto-sync** | Yes | Yes (manual update option) |
| **Subscriber notifications** | Email, SMS, Slack, webhook | Email only |
| **Custom branding** | Full CSS control | Customizable design |
| **Custom domain** | Yes | Yes |
| **Maintenance windows** | Yes | Yes |
| **Embeddable status widget** | No | Yes |
| **Pricing** | Included in platform | $19/month separate module |
## AI SRE and MCP
Uptime.com doesn't have an AI investigation layer or an MCP server. Better Stack has both in general availability. This section is largely describing what Better Stack offers that Uptime.com hasn't built yet.
### Better Stack: AI SRE and MCP server
The AI SRE activates during incidents and analyzes your service map, recent log activity, and deployment history to generate root cause hypotheses before you've had time to fully orient yourself to the incident. At 3am that's the difference between starting from a hypothesis and starting from zero.
The [Better Stack MCP server](https://betterstack.com/docs/getting-started/integrations/mcp/) connects Claude, Cursor, and other AI assistants directly to your observability data. Instead of copying log snippets into a chat window, your AI assistant can run SQL queries against your logs, check who's on call, acknowledge incidents, and build dashboards through natural language.
Setup is a single config block:
```json
{
"mcpServers": {
"betterstack": {
"type": "http",
"url": "https://mcp.betterstack.com"
}
}
}
```
The MCP server covers uptime monitoring, incident management, log querying, metrics, dashboards, error tracking, and on-call scheduling. You can enforce read-only access to prevent your AI assistant from making destructive changes.
### Uptime.com: no AI investigation layer
Uptime.com doesn't currently offer an AI SRE, autonomous incident investigation, or MCP integration. The platform surfaces check results, alerts, and reporting data through its standard UI and API. If AI-assisted root cause analysis or natural language queries against monitoring data are part of what you need, you'll need to look elsewhere for that capability.
| AI capability | Better Stack | Uptime.com |
|--------------|--------------|------------|
| **AI SRE** | Yes (autonomous incident investigation) | No |
| **MCP server** | Yes (GA, all customers) | No |
| **Natural language log queries** | Via MCP | No |
| **AI-assisted debugging** | Claude Code + Cursor integration | No |
## Error tracking
Better Stack has a dedicated error tracking product. Uptime.com doesn't. If error tracking is part of your requirements, it's another capability you'd need to source separately when building on top of Uptime.com.
### Better Stack: Sentry-compatible error tracking

[Better Stack Error Tracking](https://betterstack.com/error-tracking) accepts Sentry SDK payloads, which means if you're already using Sentry's client libraries, you can redirect data to Better Stack without touching your instrumentation. AI-native debugging with Claude Code and Cursor integration gives you pre-built prompts that summarize error context so you can start debugging without manually reading through stack traces.
Every error includes the full distributed trace that produced it. Errors, session replays, traces, and logs are all visible together for the session that generated the exception.
### Uptime.com: no error tracking
The error identification in Uptime.com's RUM module flags JavaScript errors that occur during monitored user sessions. That's quite different from application error tracking, which groups exceptions across all sessions, provides stack traces, tracks error rates over time, and links errors to deployments. If you need that capability alongside Uptime.com, you'll need a separate tool for it.
| Error tracking | Better Stack | Uptime.com |
|---------------|--------------|------------|
| **Application error grouping** | Yes | No |
| **Stack traces** | Yes | No |
| **Sentry SDK compatibility** | Yes | No |
| **AI debugging integration** | Yes (Claude Code + Cursor) | No |
| **Trace context on errors** | Yes (automatic) | No |
| **Deployment tracking** | Yes | No |
## Reporting and SLA management
Both platforms provide reporting and SLA tracking, and this is one area where Uptime.com's dedicated focus genuinely shows.
### Better Stack: dashboards and alert-based SLOs
Better Stack gives you dashboards that combine logs, metrics, traces, and uptime data. SQL and PromQL queries build visual charts, and SLO tracking works through monitor-based alerting and incident tracking. The reporting capabilities are flexible, but they're oriented toward engineering investigation rather than producing polished stakeholder-ready SLA documents.
### Uptime.com: SLA reporting as a first-class feature
Uptime.com's reporting includes dedicated SLA reports with four-decimal precision uptime calculations, scheduled reports delivered at your chosen frequency, customizable dashboards, and real-time root cause analysis. Stakeholder-ready SLA reporting is a primary use case for the platform, and the interface reflects that. It's designed for clarity and shareability in a way that Better Stack's engineering-focused dashboards aren't.
If your main audience for monitoring data is a manager or customer who wants to see uptime percentage over the last 90 days in a formatted report, Uptime.com's reporting layer is more turnkey than what Better Stack offers.
| Reporting | Better Stack | Uptime.com |
|-----------|--------------|------------|
| **SLA reporting** | Via monitors + dashboards | Dedicated SLA reports (4-decimal precision) |
| **Scheduled reports** | No | Yes |
| **Stakeholder-ready format** | Custom dashboards | Yes (built-in) |
| **Custom dashboards** | Yes (SQL + PromQL + drag-and-drop) | Yes |
| **Check history** | Configurable retention | 24 months (standard plans) |
## Enterprise readiness
Both platforms serve enterprise customers, and both have the SSO and security fundamentals that procurement processes typically require. The differences show up in compliance coverage depth and overall platform scope.
Better Stack covers what most enterprise engineering teams need: SOC 2 Type II, GDPR, SSO via Okta/Azure/Google, SCIM provisioning, RBAC, audit logs, data residency options in EU and US with optional S3 bucket hosting, a dedicated Slack support channel, and a named account manager. Enterprise SLAs are available.
Uptime.com offers SSO across all plans, which is worth noting. Most platforms reserve that for enterprise tiers. Enterprise monitoring features include private location monitoring, advanced account settings, and custom pricing for large deployments. The trust center and security documentation cover what you'd expect from a platform handling availability data.
One thing to keep in mind: the compliance requirements for a platform collecting external check results and synthetic transaction data are meaningfully different from a platform that handles your full application data stream including logs, traces, and error payloads. So the compliance comparison isn't apples-to-apples. Uptime.com's data exposure surface is narrower, and that changes what compliance certifications matter.
| Enterprise feature | Better Stack | Uptime.com |
|-------------------|--------------|------------|
| **SOC 2 Type II** | ✓ | ✓ |
| **GDPR** | ✓ | ✓ |
| **HIPAA** | ✗ | Not published |
| **SSO (SAML/OIDC)** | ✓ | ✓ (all plans) |
| **SCIM Provisioning** | ✓ | Not published |
| **RBAC** | ✓ | ✓ |
| **Audit Logs** | ✓ | ✓ |
| **Data residency** | EU + US, optional S3 bucket | Not published |
| **Private locations** | Via collector | ✓ (all plans) |
| **Dedicated support channel** | Slack channel + account manager | Enterprise tier |
| **SLA** | Enterprise SLA available | Available |
| **API access** | ✓ (Terraform provider available) | ✓ (REST API + Terraform provider) |
## Final thoughts
The choice between **Better Stack and Uptime.com** comes down to one question: **are you buying external availability monitoring, or are you buying a full observability platform that includes external monitoring?**
**Go with Better Stack if** you want a **single platform covering your full observability stack**: uptime monitoring, logs, metrics, distributed traces, error tracking, real user monitoring, incident management, and status pages. When a check fails, you immediately have **the correlated logs, metric context, and service traces** without switching products. The **AI SRE and MCP server** are production-ready capabilities that Uptime.com hasn't built. And the **volume-based pricing with no cardinality penalties or module licensing fees** gets more favorable the more you add.
Better Stack's uptime monitoring covers what most engineers need from a tool like Uptime.com. The probe network is smaller, and if **Uptime.com's 100+ global locations** are genuinely important for your monitoring coverage, that's worth weighing carefully. But the **investigation context Better Stack provides when a check fails** is the tradeoff that justifies the switch for most teams.
**Ready to see the difference?** [Start your free trial](https://betterstack.com) and see how a unified observability platform can simplify monitoring, investigation, and incident response.