# Better Stack vs StatusCake: A Complete Comparison for 2026
If you're running websites or web services and you want to know when they go down, **StatusCake has been a reliable answer to that question for over a decade**. **More than 120,000 customers use it, including IBM, Netflix, and Mastercard.** The product is focused: **uptime checks, SSL and domain monitoring, page speed tests, and a public status page.** It doesn't try to be more than that, and for a lot of people, it doesn't need to be.
**Better Stack started in the same space and grew into something different.** You still get uptime monitoring and status pages, but the platform also covers **log management, distributed tracing, infrastructure metrics, real user monitoring, error tracking, and on-call scheduling.** The pricing model **charges by data volume rather than by monitor count or seat**, and there's an **AI SRE that starts investigating automatically the moment an incident opens.**
This comparison is honest about both. There are **things StatusCake does better, things Better Stack doesn't have**, and a **fundamental question about what you actually need your monitoring tool to do.** By the end of this, **you should have a clear answer for your situation.**
## Quick comparison at a glance
| Category | Better Stack | StatusCake |
|----------|-------------|------------|
| **Uptime monitoring** | Yes (multi-location HTTP, TCP, PING, keyword) | Yes (DNS, HTTP/S, HEAD, PING, PUSH, SMTP, SSH, TCP) |
| **Check intervals** | 30 seconds | 30 seconds (Business), 1 minute (Superior) |
| **Page speed monitoring** | Yes | Yes |
| **SSL monitoring** | Yes | Yes |
| **Domain monitoring** | Yes | Yes |
| **Server/infrastructure monitoring** | Full (logs, metrics, traces) | Basic (CPU, RAM, disk thresholds) |
| **Log management** | Yes (SQL-queryable, 100% indexed) | No |
| **APM / distributed tracing** | Yes (eBPF auto-instrumentation) | No |
| **Error tracking** | Yes | No |
| **Real user monitoring** | Yes | No |
| **Incident management / on-call** | Yes (built-in, $29/responder) | No |
| **Status pages** | Yes (email, SMS, Slack, webhook) | Yes (email only on standard plans) |
| **AI SRE** | Yes (autonomous incident investigation) | No |
| **MCP server** | Yes (GA, all customers) | No |
| **Pricing model** | Data volume + responders | Monitor count + team members |
| **Free plan** | Yes | Yes (10 monitors, 5-min intervals) |
## The real difference between these two products
Before comparing individual features, it's worth being clear about what kind of tool each of these is, because that framing changes how you evaluate everything else.
StatusCake is a website monitoring tool. It watches your URLs, certificates, and domains, checks that your servers aren't running out of resources, and tells you when something crosses a threshold. That's its purpose, it does it reliably, and it's designed to do exactly that and nothing more.
Better Stack started in the same place and extended into full-stack observability. Uptime monitoring is still there, but it's connected to log management, distributed tracing, infrastructure metrics, real user monitoring, error tracking, and incident orchestration. The two products look similar in the table above when you're comparing check intervals and monitor counts. They look very different the moment something breaks.
With StatusCake, you find out that something is down. You then open your logs tool, your APM tool, and your incident management tool to understand why. With Better Stack, when an alert fires, the correlated logs, traces, and metrics are already in the same view. Is your monitoring tool just telling you that something is wrong, or is it actually helping you understand why?
For some situations, pure detection is enough. For others, that gap in investigation capability is the difference between a five-minute incident and a forty-five-minute one. Keep that framing in mind as you go through the rest of this.
## Uptime monitoring
Both products cover the fundamentals: HTTP/HTTPS checks from multiple global locations, keyword matching, SSL validation, and configurable alert thresholds. Where they diverge is in what happens after a check fails.
### Better Stack

Better Stack's uptime monitoring runs checks with 30-second intervals on paid plans. It supports HTTP/HTTPS, TCP, UDP, PING, SMTP, POP3, IMAP, and keyword assertions. You can specify expected status codes, response body content, and custom request headers for each monitor.
What makes the uptime monitoring experience different from a standalone tool is the context that surrounds a failed check. Because Better Stack stores your logs, metrics, and traces in the same platform, a failing monitor can immediately surface correlated backend errors, recent deployment activity, and infrastructure anomalies. You're not just getting a "site is down" alert. You're getting a starting point for the investigation that follows.
From there, the escalation path is built in. A failing check triggers an escalation policy, pages the right engineer, and opens a dedicated incident channel in Slack, all within the same platform. If you currently have your uptime tool wired to PagerDuty through a webhook chain, you know how many things can go wrong in that handoff. Better Stack removes the handoff entirely.
False positive prevention uses multi-location confirmation before firing any alert, so a single probe failure in one region doesn't create a 3am page for something that wasn't actually down.
### StatusCake

StatusCake's uptime monitoring is its strongest product, and the depth genuinely shows. The Superior and Business plans support eight test types including DNS, HTTP/S, HEAD, PING, PUSH, SMTP, SSH, and TCP, which covers a wider range of infrastructure protocols than most dedicated uptime tools. If you need to verify that an SSH server is reachable or that an SMTP relay is responding, StatusCake handles that natively.
**SureAlert** is StatusCake's false positive prevention system. When a monitor detects downtime, it confirms from multiple servers in the same location before sending an alert. In practice this reduces a lot of the noise you get from simpler checkers that fire on single-probe hiccups.
Check intervals go down to 30 seconds on the Business plan, which is appropriate for production services. The free tier's 5-minute intervals are too slow for anything where downtime has direct revenue impact. If you're on a 5-minute interval and a critical service goes down for 4 minutes and comes back, you'll never know it happened.
Test coverage spans 43 locations across 30 countries. Coverage in Europe and North America is thorough. If you have users in Africa or the Middle East, it's worth checking whether StatusCake has probe locations close to your audience, since coverage in those regions is thinner.
| Uptime monitoring | Better Stack | StatusCake |
|-------------------|--------------|------------|
| **Check types** | HTTP/S, TCP, UDP, PING, SMTP, POP3, IMAP, keyword | DNS, HTTP/S, HEAD, PING, PUSH, SMTP, SSH, TCP |
| **Minimum interval** | 30 seconds | 30 seconds (Business plan) |
| **Global locations** | Multiple | 43 locations, 30 countries |
| **False positive prevention** | Multi-location confirmation | SureAlert |
| **Alert channels** | Email, SMS, phone, Slack, Teams, webhook | Email, SMS, integrations |
| **Incident workflow** | Built-in, no external tools needed | External tools required |
| **Free plan monitors** | Yes | 10 monitors |
## Page speed monitoring
Slow pages cost you. Higher bounce rates, lower conversions, and degraded Core Web Vitals that affect your search rankings all trace back to load time. Both platforms give you page speed visibility, but the kind of visibility differs.
### Better Stack
Better Stack measures page speed through its real user monitoring product rather than synthetic probes. Instead of a check running from a fixed data center location, RUM captures actual user session performance including Core Web Vitals (LCP, CLS, INP) per URL. You're measuring what your real users are actually experiencing across their devices, browsers, and locations, not what a probe in a Frankfurt data center reports.
For response time alerting specifically, Better Stack's uptime monitors support thresholds that trigger before a page goes fully down. A page that's responding in 8 seconds isn't down, but your users are leaving. Better Stack can alert on that.
### StatusCake

StatusCake's page speed monitoring runs scheduled synthetic tests from your chosen probe locations. On the Business plan, you get tests every 5 minutes from up to 30 monitors. Results include full waterfall breakdowns: DNS resolution, connection time, content transfer, and load time per resource, all measured in milliseconds.
This is genuinely useful for catching which specific resources are dragging down your load time (a third-party script you can't control, an unoptimized image, a slow database query on the critical path). The trend reporting shows you whether load times are creeping up across deployments, which is the kind of slow regression that often goes unnoticed until it becomes a real problem.
The limitation is that you're seeing synthetic performance from a probe, not the distribution of real user experience. A page might load in 1.2 seconds from StatusCake's London probe and in 4.5 seconds for half your actual users on mobile connections in Southeast Asia. Synthetic monitoring won't show you that.
| Page speed | Better Stack | StatusCake |
|------------|--------------|------------|
| **Measurement type** | Real user monitoring (actual sessions) | Synthetic (probe-based) |
| **Waterfall breakdown** | Via RUM session data | Yes |
| **Core Web Vitals** | LCP, CLS, INP per URL | Not included |
| **Alert on slow loads** | Yes | Yes |
| **Historical trends** | Yes | Yes |
## SSL and domain monitoring
### Better Stack
Better Stack covers SSL certificate expiry and domain registration expiry, alerting you before either lapses. Both are included in the platform without separate monitor allocations.
### StatusCake
This is one of the areas where StatusCake's specialization pays off. Beyond expiry alerts, you get **SSL certificate scoring** that grades your cipher strength and TLS configuration, **mixed content alerts** that identify pages serving insecure resources over HTTPS connections, and flexible expiry warning windows.
Domain monitoring goes further than most tools. StatusCake checks expiry dates but also supports **domain record monitoring**, which alerts you when DNS records change unexpectedly, and **blacklist monitoring**, which tells you if your domain appears on spam or malware blacklists. If you're managing domains for clients or running a SaaS product where a DNS hijack would be catastrophic and invisible, these two features provide real coverage that Better Stack currently doesn't.
On the Business plan, SSL checks run every 10 minutes and domain checks every 5 days. These come as separate monitor allocations (100 SSL monitors, 120 domain monitors) rather than unlimited.
| SSL and domain | Better Stack | StatusCake |
|----------------|--------------|------------|
| **SSL expiry alerts** | Yes | Yes |
| **SSL certificate scoring** | No | Yes |
| **Mixed content alerts** | No | Yes |
| **Domain expiry alerts** | Yes | Yes |
| **Domain record monitoring** | No | Yes |
| **Blacklist monitoring** | No | Yes |
If SSL and domain health management is a major part of what you do, particularly if you're an agency managing dozens of client domains, StatusCake's granularity here is genuinely better than Better Stack's.
## Server monitoring
### Better Stack
Better Stack's server monitoring goes considerably deeper than threshold alerting. The eBPF collector deploys as a Kubernetes DaemonSet or Docker container and automatically discovers services, captures HTTP traffic between them, and instruments database queries without any code changes.
**Infrastructure metrics** cover CPU, memory, disk, network, and custom application metrics via Prometheus. Everything is queryable with PromQL and SQL. There are no cardinality penalties, so you can tag metrics with high-cardinality dimensions like deployment version or customer tier without that decision showing up as a surprise on your bill next month.
**Log management** stores 100% of ingested logs as immediately searchable structured data. You're not making indexing decisions upfront or choosing which logs to keep searchable before you know which ones you'll need. When an incident fires at midnight, every log from the past N days is available for SQL queries, not just the fraction you decided was worth indexing in advance.
**Distributed tracing** connects requests across your services automatically, building flamegraphs and dependency maps. When a monitor fires, you can follow a request from the original HTTP check through your load balancer, application servers, and database calls, all without leaving the platform.
Watch how Better Stack's data collection works end to end:
### StatusCake
StatusCake's server monitoring checks CPU, RAM, and disk thresholds on Linux hosts. You set limits, and StatusCake alerts when they're exceeded. The Business plan includes 10 server monitors.
That's it. There's no log collection, no distributed tracing, no query interface. When StatusCake tells you that CPU is at 95%, you still don't know which process, which request, or which code path is responsible. Have you ever stared at a high-CPU server alert and had to open three other tools before you could even form a hypothesis about the cause? That's the gap this level of server monitoring leaves. For simple applications it's fine. For anything with real backend complexity, threshold alerting alone isn't enough to actually run your systems.
| Server monitoring | Better Stack | StatusCake |
|-------------------|--------------|------------|
| **CPU / RAM / disk alerts** | Yes | Yes |
| **Log collection** | Yes (100% searchable, SQL) | No |
| **Distributed tracing** | Yes (eBPF, zero code changes) | No |
| **Infrastructure metrics** | Full (Prometheus/PromQL) | Thresholds only |
| **Database query tracing** | Yes (Postgres, MySQL, Redis, MongoDB) | No |
| **Service maps** | Yes | No |
## Pricing comparison
The two platforms charge differently enough that it's worth working through the numbers carefully, because the right answer depends on what you're actually buying.
### StatusCake
StatusCake's pricing is straightforward and transparent. You pay by monitor count and team size.
**Free plan:** 10 uptime monitors, 5-minute intervals, 1 page speed monitor, 1 domain monitor, 1 SSL monitor, single login.
**Superior plan: $20.41/month (billed annually)** or $24.49/month monthly. Includes 2 team members, 100 uptime monitors, 1-minute intervals, 15 page speed monitors, 50 domain monitors, 50 SSL monitors, 3 server monitors, 75 SMS credits.
**Business plan: $66.66/month (billed annually)** or $79.99/month monthly. Includes 10 team members, 300 uptime monitors, 30-second intervals, 30 page speed monitors, 120 domain monitors, 100 SSL monitors, 10 server monitors, 400 SMS credits, public status page, audit logs, and sub-accounts.
**Custom plans** are negotiated for larger organizations and include dedicated monitoring locations, unlimited monitors, constant check rates, and service-creditable SLAs.
At $67/month for the Business plan, you're getting a lot of monitors for a very low per-monitor cost. If uptime monitoring is literally your entire requirement, that's genuinely good value. But when did "uptime monitoring and nothing else" last describe everything you needed to run your services?
### Better Stack
Better Stack separates uptime monitoring pricing from observability pricing. Uptime monitors use monitor-count pricing on a free tier that scales with paid plans. The observability stack uses volume-based pricing:
**Logs:** $0.10/GB ingestion + $0.05/GB/month retention. All ingested logs are searchable, no indexing fees on top.
**Metrics:** $0.50/GB/month. No cardinality penalties.
**Traces:** $0.10/GB ingestion + $0.05/GB/month retention.
**Error tracking:** $0.000050 per exception.
**On-call / incident management:** $29/month per responder, including unlimited phone and SMS alerts.
**Monitors:** $0.21/month each.
For a 100-host deployment across logs, metrics, traces, error tracking, and 5 on-call responders, you're looking at roughly $791/month. If you're using Better Stack for uptime and status pages only, the pricing is competitive with StatusCake. The number diverges as you add observability depth, but so does the scope of what you're getting.
### 3-year TCO comparison
For a team running uptime monitoring, status pages, and basic on-call alerting:
| Category | Better Stack | StatusCake |
|----------|-------------|------------|
| Uptime monitoring (3 years) | ~$2,160 | ~$2,400 (Business plan) |
| Status pages | Included | Included (Business) |
| On-call / SMS alerts | $5,220 (5 responders) | SMS credits from plan, no phone calls |
| Log management | $3,600 (50GB/mo) | Not available |
| APM / tracing | Included in platform | Not available |
| Error tracking | ~$1,800 (5M exceptions/yr) | Not available |
| **Total (monitoring + on-call only)** | **~$7,380** | **~$2,400** |
| **Total (with full observability)** | **~$12,780** | **Not available** |
StatusCake is cheaper for pure uptime monitoring. That's a real difference and worth acknowledging. Better Stack becomes the lower-cost option once you factor in the log management tool, APM tool, and incident management tool you'd be paying for separately alongside StatusCake. What tools are you already paying for today that a unified platform would make redundant?
## Alerting and on-call management
### Better Stack
Better Stack's incident management is fully built in. You get on-call rotation scheduling, multi-tier escalation policies, unlimited phone and SMS alerts, and Slack-native incident channels, all without connecting an external tool.
A failing monitor escalates automatically through whatever policy you've configured. Here's how the on-call workflow looks in practice:
When an incident opens, it creates a dedicated Slack channel with investigation tools built in. After resolution, a post-mortem is generated automatically from the incident timeline so you're not writing it from memory two days later:
### StatusCake
StatusCake sends alerts through email, SMS (using plan credits), Slack, PagerDuty, OpsGenie, Zapier, and a handful of other integrations. It doesn't include on-call scheduling. If you need rotation management, multi-tier escalation, or phone call delivery, you'll connect PagerDuty or OpsGenie separately.
The alerting configuration itself is solid. You can set contact groups for different monitors, tune how long a monitor needs to be down before alerting, configure repeat alert intervals, and set up recovery notifications. For simple "notify this person when the site is down" use cases, it works well.
The SMS credit model is worth thinking about before you commit. The Business plan includes 400 SMS credits per month. During normal operations, that's plenty. During a sustained incident where multiple monitors are firing repeatedly, you can exhaust credits quickly. If you've ever run out of SMS credits during a high-severity incident, you know why unlimited SMS matters. The periods when you most need reliable alert delivery are exactly when volume is highest.
| Alerting and on-call | Better Stack | StatusCake |
|----------------------|--------------|------------|
| **Alert channels** | Email, SMS, phone, Slack, Teams, webhook, push | Email, SMS, integrations |
| **Phone call alerts** | Yes (unlimited, included) | No |
| **On-call scheduling** | Built-in | Via PagerDuty/OpsGenie |
| **Escalation policies** | Built-in | Via external tools |
| **Incident channels** | Native Slack/Teams | Via Slack integration |
| **Post-mortems** | Automatic | Not included |
| **SMS model** | Unlimited (included in $29/responder) | Credit-based (capped per plan) |
## Status pages and customer communication
When your service goes down, your customers find out one way or another. Whether they find out from your status page or from social media matters a lot to how the incident is perceived. Both platforms include status page functionality, but the features differ enough to be worth examining.
### Better Stack
[Better Stack Status Pages](https://betterstack.com/status-page) syncs automatically with the incident management system. When an incident opens internally, the public status page updates. When you post an update, subscribers get notified via email, SMS, Slack, or webhook. The internal response and external communication stay in sync by default rather than by manual coordination.
You get public and private pages, custom branding and domains, real-time incident updates, scheduled maintenance windows with subscriber notifications, and multi-language support. Private pages support password protection, SAML SSO, or IP allowlisting. Custom CSS gives you complete visual control if your brand requires it.
**Pricing:** $12-208/month for advanced features, included with the incident management plan.
### StatusCake
StatusCake includes a public status page on the Business plan. It shows your uptime history for the past 7 days, which lets customers check whether a problem they experienced correlates with actual downtime. Component-level status display supports operational, degraded, partial outage, and major outage states. You can publish incident announcements manually.
The main limitation is subscriber notifications. Standard plans only support email. There's no SMS or Slack notification for subscribers. Private or password-protected status pages aren't available on standard plans. If your customers expect to subscribe to a Slack channel or receive a text when you have an outage, you won't be able to offer that through StatusCake's standard setup.
StatusCake also offers ChangeCrab, a separate changelog product that integrates with monitoring to show a mini status widget inside your changelog. It's a nice feature for SaaS products that want status and release notes in the same place, but it's a separate tool and subscription, not part of the core platform.
| Status pages | Better Stack | StatusCake |
|--------------|--------------|------------|
| **Subscriber notifications** | Email, SMS, Slack, webhook | Email only |
| **Private pages** | Password, SSO, IP allowlist | Not on standard plans |
| **Incident sync** | Automatic | Manual |
| **Custom domain** | Yes | Yes |
| **Custom CSS** | Yes | Limited |
| **Maintenance windows** | Yes, with subscriber alerts | Yes |
| **Changelog integration** | No | Via ChangeCrab (separate) |
## Real user monitoring
This is a section where the comparison is simple: StatusCake doesn't have it, Better Stack does.
### Better Stack RUM

Better Stack RUM captures session replays, Core Web Vitals (LCP, CLS, INP) per URL, JavaScript errors, website analytics, and product analytics with auto-captured user events. Because it lives in the same data warehouse as your backend logs and traces, you can follow a slow page load directly to the backend request that caused it. No cross-product correlation to wire up, no switching interfaces to see the full picture.
Session replay lets you watch user sessions filtered by rage clicks, dead clicks, errors, and other frustration signals. Playback automatically skips inactivity. PII is excluded at the SDK level so you're not recording sensitive fields.
Website analytics tracks referrers, UTM campaigns, entry and exit pages, and user agents in real time. When a traffic spike hits, you can see where it's coming from and correlate it directly with backend load.
For 5M web events and 50K session replays per month, the cost is approximately $102. The same volume on Datadog RUM runs closer to $405.
### StatusCake
StatusCake doesn't offer real user monitoring, session replay, or frontend error tracking. The page speed monitoring gives you synthetic load time measurements from probe locations, which is useful but not the same thing. If frontend observability matters to you, you'd need to add a separate RUM tool like PostHog, Sentry, or Datadog RUM alongside StatusCake, which means another subscription and another interface.
## Error tracking
### Better Stack
[Better Stack Error Tracking](https://betterstack.com/error-tracking) accepts Sentry SDK payloads. If you're already using Sentry's SDKs, you can migrate without rewriting any instrumentation. Errors group into issues automatically, with full distributed trace context showing what requests led to each exception.
The AI-native debugging workflow is worth highlighting. Better Stack integrates with Claude Code and Cursor, providing pre-built prompts that summarize error context. Instead of manually reading stack traces and constructing a prompt yourself, you copy the pre-built prompt into your AI coding environment and start investigating immediately.
### StatusCake
StatusCake doesn't include error tracking. You find out about errors indirectly: a monitor fails because the application is returning 500s, or a user complains. Application exceptions are not captured, grouped, or surfaced as first-class data. If knowing which errors are happening in your application (not just that monitors are failing) matters to you, you'll need a separate tool for it.
## AI SRE and MCP integration
The two platforms are in completely different positions here. StatusCake has no AI features. Better Stack ships an AI SRE and an MCP server that are both generally available to all customers.
### Better Stack
**AI SRE** activates the moment an incident opens. It analyzes your service map, queries logs, reviews recent deployments, and proposes likely root causes without waiting for you to prompt it. At 3am, that means you're starting from a hypothesis rather than a blank screen.
The **[Better Stack MCP server](https://betterstack.com/docs/getting-started/integrations/mcp/)** connects Claude, Cursor, and any MCP-compatible AI client directly to your observability data. Your AI assistant can run SQL queries against your logs, check who's on-call, acknowledge incidents, and build dashboard charts through natural language. No copying log snippets into chat windows.
```json
{
"mcpServers": {
"betterstack": {
"type": "http",
"url": "https://mcp.betterstack.com"
}
}
}
```
This isn't a preview feature. The MCP server is generally available to all Better Stack customers today.
### StatusCake
StatusCake doesn't offer AI-native features, an AI SRE, or an MCP server. It's a monitoring tool built before that category of feature existed, and as of this writing, it hasn't moved into that space.
| AI capability | Better Stack | StatusCake |
|---------------|--------------|------------|
| **AI SRE** | Yes (autonomous incident investigation) | No |
| **MCP server** | Yes (GA, all customers) | No |
| **Natural language log queries** | Via MCP in any AI client | No |
| **AI coding integration** | Claude Code + Cursor | No |
## Log management
### Better Stack
[Better Stack logs](https://betterstack.com/logs) ingests structured and unstructured logs, indexes 100% of them immediately, and makes them searchable via SQL. You're not choosing upfront which logs are worth keeping searchable and which get archived. All of them are queryable when you need them.
```sql
SELECT
service_name,
COUNT(*) as error_count,
AVG(duration_ms) as avg_duration
FROM logs
WHERE level = 'error'
AND timestamp > NOW() - INTERVAL '1 hour'
GROUP BY service_name
ORDER BY error_count DESC
```
Live Tail gives you real-time log streaming with filtering while the incident is happening:
Queries can be saved as presets, converted to charts, and added to dashboards:
Integrations cover 100+ sources across all major stacks: MCP, OpenTelemetry, Vector, Prometheus, Kubernetes, Docker, PostgreSQL, MySQL, Redis, MongoDB, Nginx, and more.
### StatusCake
StatusCake doesn't include log management. There's no log collection, no log search, and no log-based alerting. If a monitor fires because your application is returning errors, you open a separate tool to investigate what's happening in your logs.
This is the most significant capability gap between the two platforms. How many separate tools do you currently open during an average incident before you can even start forming a theory about what went wrong? If that number is more than one, it's worth thinking about what that overhead costs you during every incident.
## Infrastructure monitoring and metrics
### Better Stack
[Better Stack metrics](https://betterstack.com/infrastructure-monitoring) collects infrastructure and application metrics via Prometheus exporters and OpenTelemetry, storing them alongside your logs and traces. Full PromQL support. No cardinality penalties, which means you can tag metrics with high-cardinality dimensions freely without those decisions showing up as unexpected charges.
You can build charts with PromQL if you already know it:
Or skip the query language and use the drag-and-drop builder:
### StatusCake
StatusCake records CPU, RAM, and disk usage and alerts when thresholds are exceeded. There are no custom metrics, no Prometheus integration, and no time-series storage with query capability. Threshold alerting is all you get. It's not metrics infrastructure, it's resource monitoring.
## Application performance monitoring and distributed tracing
### Better Stack
[Better Stack's APM](https://betterstack.com/tracing) uses eBPF to capture distributed traces automatically without SDK installation or code changes. Deploy the collector, and HTTP traffic between your services starts generating traces within minutes.
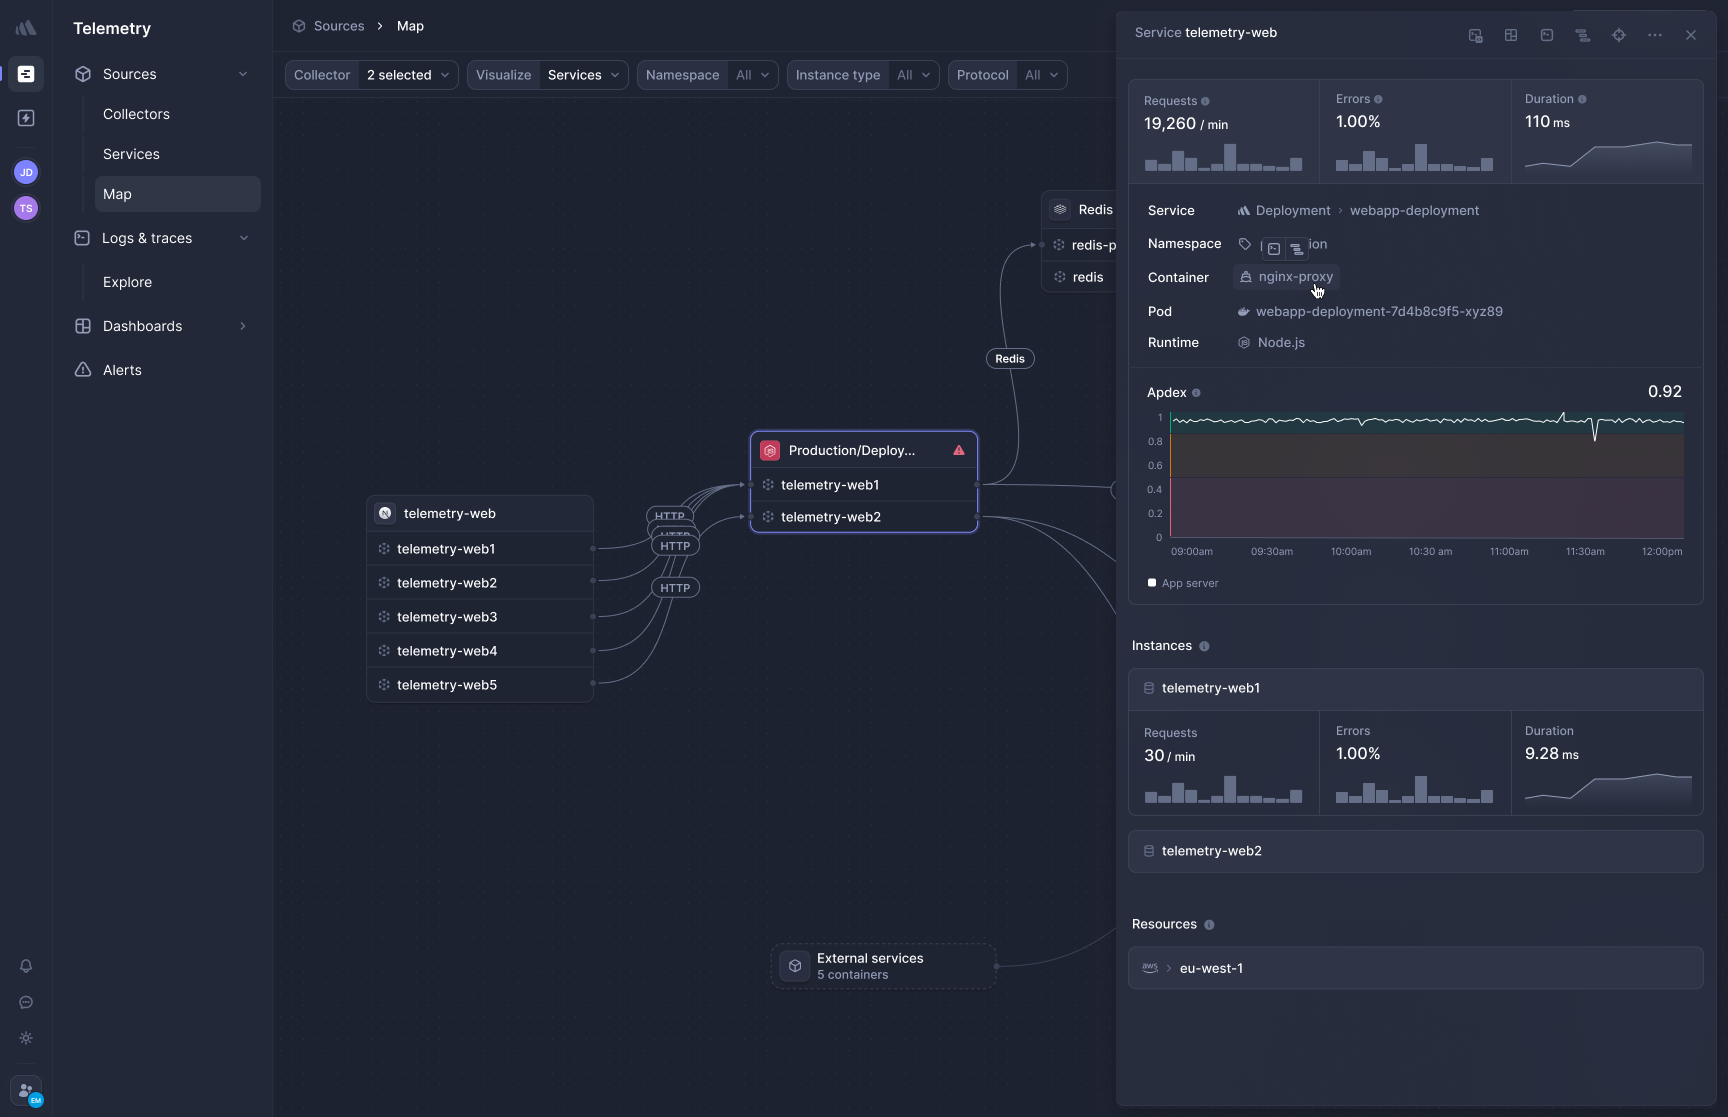
**Frontend-to-backend correlation** connects browser sessions to backend traces. When a page load is slow, you can follow it from the frontend request through your load balancer, application services, and database calls in one view without switching products.
**OpenTelemetry-native, zero lock-in.** Your traces use the OTel format natively. If you ever need to move your data elsewhere, it's a configuration change, not a migration project involving rewriting instrumentation across every service.
### StatusCake
StatusCake has no APM product. There's no distributed tracing, no service map, no flamegraph visualization, and no request-level latency breakdown. If you're debugging a latency issue, your only server-side signal is aggregate resource metrics. If CPU and RAM look normal, StatusCake can't tell you what's actually slow.
## Enterprise readiness
### Better Stack
Better Stack covers the compliance and access control requirements that most enterprise procurement processes need. SSO via Okta, Azure, and Google (SAML/OIDC). SCIM provisioning for automated user lifecycle management. RBAC with granular permission controls. Audit logs. Data residency options in EU and US regions, with an optional self-hosted S3 bucket if you need data to stay on your own infrastructure.
Enterprise customers get a dedicated Slack support channel and a named account manager. That distinction matters when you need a fast human response during a major incident, not a ticket number and a three-hour SLA.
**Compliance:** SOC 2 Type II, GDPR. Data stored in DIN ISO/IEC 27001-certified centers. AES-256 at rest, TLS in transit. Regular third-party penetration testing with reports available to enterprise customers on request.
**The honest gap:** Better Stack doesn't have HIPAA compliance or FedRAMP authorization. If you're in healthcare or US federal government with hard regulatory requirements for either, this is a real constraint that rules Better Stack out for those specific contexts.
### StatusCake
StatusCake's Business plan includes audit logs, sub-accounts, and team management for up to 10 members. Custom enterprise plans support unlimited members with dedicated monitoring locations and account reviews.
StatusCake's compliance posture isn't prominently documented publicly. There's no public SOC 2 report or GDPR certification statement on the website. If you're going through an enterprise procurement process that requires documented compliance certifications, this is a gap you'd need to clarify directly with their sales team before committing.
That said, StatusCake has been running production monitoring for IBM, Netflix, and Mastercard for years, which is meaningful evidence of operational reliability even if the compliance documentation isn't front and center.
| Enterprise feature | Better Stack | StatusCake |
|--------------------|--------------|------------|
| **SOC 2 Type II** | ✓ | Not publicly documented |
| **GDPR** | ✓ | Not publicly documented |
| **HIPAA** | ✗ | Not publicly documented |
| **SSO (SAML/OIDC)** | ✓ (Okta, Azure, Google) | Not on standard plans |
| **SCIM provisioning** | ✓ | Not documented |
| **RBAC** | ✓ | Team member roles |
| **Audit logs** | ✓ | ✓ (Business plan) |
| **Data residency** | EU + US, optional S3 | Not documented |
| **Dedicated support channel** | Slack + named account manager | Account reviews on custom plans |
| **SLA** | Enterprise SLA available | Service-creditable SLA (custom plans) |
## Deployment and integrations
### Better Stack
The eBPF collector deploys via a single Helm chart to Kubernetes. Services, databases, and HTTP traffic between services are discovered automatically without touching application code or coordinating instrumentation across engineering teams. If you're already using OpenTelemetry, Better Stack accepts OTel-formatted data natively with no extra configuration.
For log shipping, Vector, Fluentd, and Filebeat all integrate directly. Adding a new service to monitoring often requires no work at all: the eBPF collector picks it up the next time it polls.
The [MCP server](https://betterstack.com/docs/getting-started/integrations/mcp/) means your AI assistant can query, acknowledge, and investigate inside your observability data directly, rather than you copying log excerpts into a chat window and hoping the context is enough.
**Integrations:** 100+ covering all major stacks: MCP, OpenTelemetry, Vector, Prometheus, Kubernetes, Docker, PostgreSQL, MySQL, Redis, MongoDB, Nginx, and more.
### StatusCake
StatusCake setup is fast for what it does. Adding a monitor means filling out a form with a URL, test type, check interval, and alert contacts. No agents, no SDK installation, no infrastructure changes. For website monitoring specifically, you can go from account creation to active monitoring in under five minutes.
Server monitoring requires a lightweight agent on Linux hosts. It reports CPU, RAM, and disk metrics back to the platform.
For integrations, StatusCake connects to Slack, PagerDuty, OpsGenie, Zapier, VictorOps, and other alerting tools. The list covers alert routing destinations well but doesn't extend into observability data pipelines, because StatusCake doesn't collect that type of data.
| Deployment | Better Stack | StatusCake |
|------------|--------------|------------|
| **Time to first monitor** | Minutes | Minutes |
| **Infrastructure agent** | eBPF collector (Kubernetes/Docker) | Lightweight agent (server monitoring only) |
| **Code changes required** | Zero | Zero for uptime; agent for server monitoring |
| **OpenTelemetry support** | Native | No |
| **Integration scope** | 100+ (observability stack) | 40+ (alerting/notification tools) |
| **AI assistant integration** | MCP server (GA) | No |
## Final thoughts
The choice here really does come down to one question: **do you need monitoring, or do you need observability?**
**StatusCake answers the monitoring question well.** It watches your URLs, certificates, and domains, sends alerts reliably, and gives your customers a status page. Its longevity in the market and its customer list are real evidence of a reliable product. There's a legitimate argument for a tool that **does five things well rather than one that does twenty things adequately**, and StatusCake is that tool.
**Better Stack answers a different question: when something breaks, how fast can you figure out why?** Uptime monitoring is the detection layer. The investigation that follows happens in **logs, traces, metrics, and session replays**. Better Stack gives you all of that in one platform, with a pricing model that **doesn't punish you for tagging metrics, indexing logs, or adding services.**
**How much of your last incident response was spent gathering data from separate tools rather than actually solving the problem?** If the answer is **"more than it should be,"** that's not a monitoring problem. **That's an observability gap, and a second uptime checker isn't going to close it.**
If you're already paying for **StatusCake plus a log management tool plus an on-call tool**, the total almost certainly exceeds what Better Stack would cost for the same footprint. **The math tends to favor consolidation once you count everything.**
**Ready to see the difference?** [Start your free trial](https://betterstack.com) or [compare pricing](https://betterstack.com/pricing) to see how much you could consolidate.