# Better Stack vs Sentry: A Complete Comparison for 2026
Sentry earned its place in nearly every developer's toolkit the honest way: it made error tracking so good, so easy to set up, and so genuinely useful that "just add Sentry" became a default step in project setup for over a decade. And Sentry hasn't stood still. Structured logs went GA in September 2025, Seer (its AI debugging agent) ships fixes as pull requests, and the platform now stretches into tracing, profiling, session replay, and uptime monitoring.
But here's the thing about a platform that grew outward from error tracking: everything is organized around the *issue*, and the moment your problem isn't an issue, a server running hot, a database connection pool exhausting, an incident that needs a human paged and a status page updated, you're outside what Sentry was built to do. **Sentry has no infrastructure monitoring, no host metrics, no on-call scheduling with phone and SMS delivery, and no status pages.** Most teams end up running Sentry alongside two or three other tools to cover the full reliability picture.
Better Stack covers that full picture in one platform: log management, metrics, distributed tracing, error tracking, uptime monitoring, incident management with on-call scheduling, and status pages, priced on data volume with no per-seat fees and no AI add-on charges. And because **Better Stack accepts Sentry SDK payloads natively**, migrating your error tracking takes a config change, not a re-instrumentation project. Keep the SDKs your team already knows; point them somewhere that does more.
**If you want the debugging workflow Sentry pioneered plus the infrastructure, incident, and customer-communication layers it never built, Better Stack is the stronger choice.** If your only need is application-level error tracking with best-in-class AI autofix, Seer is a real capability worth weighing. This comparison covers both sides so you can make the right call.
## Quick comparison at a glance
| Category | Better Stack | Sentry |
|----------|-------------|--------|
| **Primary purpose** | Full-stack observability + incident management | Developer-first error tracking and debugging |
| **Error tracking** | Yes (Sentry SDK compatible) | Yes (the foundational product) |
| **Log management** | Yes (unified warehouse, SQL) | Yes (trace-connected, app-focused) |
| **Infrastructure monitoring** | Yes (eBPF, host metrics, Kubernetes) | No |
| **Distributed tracing** | Yes (eBPF, zero code changes) | Yes (SDK-based spans) |
| **Uptime monitoring** | Yes (full product, global checks) | Basic (1 monitor included, $1/monitor after) |
| **Incident management** | Built-in (phone, SMS, on-call, escalation) | No (alerts via integrations only) |
| **Status pages** | Built-in | No |
| **Session replay** | Yes | Yes |
| **AI capabilities** | AI SRE + MCP server (included) | Seer ($40/contributor/month add-on) |
| **Query language** | SQL + PromQL | Per-product search syntax |
| **Users** | Unlimited | Unlimited (paid plans) |
| **Pricing model** | Data volume + responders | Usage per event type + AI add-on |
| **Enterprise compliance** | SOC 2 Type II, GDPR | SOC 2, HIPAA BAA, ISO 27001 (Enterprise only) |
## Platform architecture
Sentry and Better Stack organize telemetry around fundamentally different units. Sentry organizes around the issue: an error or performance problem, with logs, traces, and replays attached as context. Better Stack organizes around a unified data warehouse where logs, metrics, and traces coexist as wide events, queryable together with SQL. Why does this matter? Because it determines what questions you can ask. Sentry answers "why did this error happen?" brilliantly. Better Stack answers that question and also "why is this host slow?", "what's our p99 across all services?", and "who's on call right now?"
### Better Stack: unified architecture
Better Stack consolidates all telemetry into a single storage layer. No separate backends, no product boundaries, no switching between interfaces when you're investigating an incident at 3am. Watch how the Better Stack collector discovers services and captures telemetry automatically:
**eBPF collector** runs at the Linux kernel level, intercepting network calls, database queries, and HTTP traffic without any code modifications. Deploy to Kubernetes via a single Helm chart, and within minutes the collector discovers every service running on the node. This is a categorically different starting point from Sentry, where visibility requires an SDK inside every application and stops at the application boundary. Sentry cannot see your hosts, your containers, or your databases as infrastructure. Better Stack sees all of it.
**Unified storage** means every log line, metric data point, trace span, and error goes into the same warehouse and becomes searchable immediately. **Query everything with SQL or PromQL.** Your team already knows the syntax.

### Sentry: issue-centric, SDK-based
Sentry's architecture starts with SDKs installed in your applications. When an exception fires, the SDK captures the stack trace, breadcrumbs, and context, and Sentry's grouping model deduplicates similar events into issues. Everything else Sentry has added, logs, traces, profiles, replays, attaches to this issue-centered model, which is genuinely elegant for its purpose: when something breaks in your code, the full debugging context is already assembled on one page.

**Where this breaks down:** the model has no concept of anything that isn't application code. There is no host view, no container metrics, no service topology derived from actual network traffic, and no way to ask questions about your system that don't start from an application event. Sentry's own positioning is honest about this; it is a debugging platform, not an observability platform. The practical consequence is that Sentry is almost always one tool among several: Sentry for errors, something else for infrastructure, something else for on-call, something else for status pages. How many vendors are you paying to cover what one platform could?
| Architecture aspect | Better Stack | Sentry |
|---------------------|--------------|--------|
| **Data collection** | eBPF (kernel-level, zero code) + SDKs | SDKs only (per-application) |
| **Visibility scope** | Full stack (infra + apps + user) | Application layer only |
| **Storage model** | Unified warehouse (all telemetry together) | Per-product stores, issue-linked |
| **Query language** | SQL + PromQL (universal) | Per-product search syntax |
| **Service topology** | Automatic from eBPF discovery | No |
| **Host/container metrics** | Yes | No |
| **Time to first insights** | Minutes after deployment | Minutes after SDK install |
## Error tracking
This is Sentry's home turf, so let's be direct about what that means, and about the one architectural decision that makes this comparison different from every other one Sentry appears in.
### Better Stack: Sentry SDK compatible, unified backend

[Better Stack Error Tracking](https://betterstack.com/error-tracking) accepts Sentry SDK payloads natively. Read that again, because it changes the entire migration calculus: **you keep Sentry's mature, well-documented SDKs, in every language and framework your team uses, and simply point the DSN at Better Stack.** No re-instrumentation, no new libraries to learn, no migration project that takes a quarter. The SDKs Sentry spent a decade perfecting become the on-ramp.
What you gain on the other side: every error lands in the same warehouse as your logs, metrics, and traces, so an exception links to its full distributed trace, the surrounding logs, and the infrastructure state of the host it happened on, context Sentry structurally cannot provide because it can't see your infrastructure. **AI-native debugging** with Claude Code and Cursor integration provides pre-made prompts that summarize error context for your coding agent. **Pricing: $0.000050 per exception.** Five million exceptions a month costs $250, with no per-seat fees and no AI add-on required.
### Sentry: the deepest standalone error tracker
Credit where it's due: Sentry's error tracking remains the most refined in the industry. Its grouping model (recently updated to prevent 20% more duplicate issues) is excellent. Suspect commit detection ties errors to the code change that caused them. Code ownership rules route issues to the right engineer automatically. Release health tracks crash-free session rates so a bad deploy surfaces as a metric before it surfaces as tickets. If error tracking is evaluated in isolation, Sentry's feature depth is real.
**The tradeoff:** all of that depth lives inside a platform that ends at your application's edge. When the root cause of the exception is a saturated database host or a failing node, Sentry shows you the stack trace and stops. You context-switch to another tool to keep investigating. Better Stack keeps the investigation in one place.
| Error tracking | Better Stack | Sentry |
|----------------|--------------|--------|
| **Sentry SDK support** | Yes (native, first-class) | Yes (its own) |
| **Issue grouping** | Yes | Yes (advanced ML model) |
| **Suspect commits** | Via source integration | Yes (deep) |
| **Linked infrastructure context** | Yes (same warehouse) | No |
| **Linked full trace + logs** | Automatic | Yes (trace-connected) |
| **AI debugging** | Claude Code/Cursor integration (included) | Seer ($40/contributor/month) |
| **Pricing** | $0.000050 per exception | Tiered per-error rates + plan base |
[summary]
### Keep the Sentry SDKs. Upgrade the platform behind them.
Better Stack accepts Sentry SDK payloads natively, so migrating your error tracking is a config change rather than a re-instrumentation project. Your errors land alongside logs, metrics, traces, and incident management in one platform.
**Every error linked to its trace, its logs, and its host, automatically.** [Explore error tracking.](https://betterstack.com/error-tracking)
[/summary]
## Pricing comparison
Both platforms reject per-seat pricing, which puts them on the same side of the industry's most important pricing divide. The differences are in what's included and what's an add-on.
### Better Stack: everything included, volume-based
**Pricing structure:**
- Logs: $0.10/GB ingestion + $0.05/GB/month retention (all searchable)
- Traces: $0.10/GB ingestion + $0.05/GB/month retention
- Metrics: $0.50/GB/month (no cardinality penalties)
- Error tracking: $0.000050 per exception
- Responders: $29/month (unlimited phone/SMS)
- Monitors: $0.21/month each
- AI SRE and MCP server: included
- Status pages: included
**Mid-size team example (15 engineers, 5M exceptions, 300GB logs, 5 responders, 50 monitors): ~$651/month**
- Error tracking (5M exceptions): $250
- Logs (300GB): $45 ingestion + retention
- Traces and metrics: ~$100
- 5 Responders: $145
- 50 Monitors: $10.50
- On-call, escalations, status pages, AI SRE: $0
**No per-contributor AI fees, no per-event-type plan gates, no separate incident management bill.**
### Sentry: reasonable base, add-ons that stack up
Sentry's Team plan starts at $26/month and Business at $80/month, both with unlimited users, and the included quotas (50K errors, 5GB logs, 5M spans, 50 replays) are genuinely usable for small teams. Beyond quota, pay-as-you-go rates apply per event type, with tiered per-error pricing from $0.0003625 down to $0.00015 at volume.
The costs that accumulate: **Seer, the AI debugger, is $40/month per active contributor** (anyone with 2+ PRs in a connected repo), on top of your plan. A team with 15 active contributors pays $600/month for Seer alone. Session replays beyond 50 are metered. Uptime monitors beyond the first are $1/month each. And then there's everything Sentry doesn't sell at all: on-call scheduling means adding PagerDuty ($49-83/user/month), status pages mean adding Statuspage or Instatus, and infrastructure monitoring means adding an entire second observability platform.
**The real comparison isn't Sentry vs Better Stack. It's Sentry + PagerDuty + Statuspage + an infrastructure tool vs Better Stack.**
| Cost component (15-engineer team) | Better Stack | Sentry stack |
|-----------------------------------|--------------|--------------|
| Platform base | $0 | $80/month (Business) |
| Error tracking (5M exceptions) | $250 | ~$750-900 (tiered PAYG) |
| Logs (300GB) | ~$60 | ~$150 ($0.50/GB) |
| AI debugging (10 contributors) | Included | $400 (Seer) |
| On-call (5 responders) | $145 | ~$245-415 (PagerDuty) |
| Status pages | Included | ~$29-99 (Statuspage/Instatus) |
| Infrastructure monitoring | Included | Requires separate platform |
| **Monthly total** | **~$650** | **~$1,650-2,050 + infra tool** |
[summary]
### One bill for the whole reliability lifecycle
Sentry's unlimited-user pricing is genuinely developer-friendly, but the add-ons and companion tools add up fast. Better Stack includes error tracking, logs, metrics, traces, uptime, on-call, incident management, AI SRE, and status pages in one volume-based bill.
**Stop paying four vendors to cover one workflow.** [Compare pricing.](https://betterstack.com)
[/summary]
## Log management
Sentry shipping structured logs in 2025 was a real addition, and its trace-connected design is smart. But the two products are built for different log volumes and different questions.
### Better Stack: full log management at scale
[Better Stack logs](https://betterstack.com/logs) stores all logs alongside metrics and traces in the same data warehouse. **Every ingested log is immediately searchable with SQL**, from every source: applications, hosts, containers, load balancers, databases, syslog, Vector, OpenTelemetry, and 100+ integrations. Watch Live Tail stream logs in real time:
**SQL querying** means your team writes analytics-grade queries against raw logs:
```sql
SELECT
service_name,
COUNT(*) as error_count,
AVG(duration_ms) as avg_duration
FROM logs
WHERE level = 'error'
AND timestamp > NOW() - INTERVAL '1 hour'
GROUP BY service_name
ORDER BY error_count DESC
```
Turn queries into dashboards:
**Pricing: $0.10/GB ingestion + $0.05/GB/month retention.** Half of Sentry's $0.50/GB rate at the ingestion step, and at real log volumes (hundreds of GB to TB monthly) the gap becomes decisive.
### Sentry: trace-connected logs, app-scoped
Sentry Logs attaches `trace_id` and `span_id` to every entry automatically, so clicking from a log line into the request waterfall is seamless, and structured attributes are searchable without parser configuration. For application-level debugging, this design is genuinely good. Here's a hands-on look:
The constraints: logs come primarily from Sentry SDKs and a limited set of log drains, not from your full infrastructure. There's no SQL, no long-term analytical querying, and at $0.50/GB beyond the 5GB free allowance, Sentry's own positioning ("not meant to replace existing log storage") tells you where the boundaries are. Sentry Logs augments debugging; it doesn't replace a log management platform.
| Log management | Better Stack | Sentry |
|----------------|--------------|--------|
| **Sources** | Everything (apps, infra, 100+ integrations) | Primarily app SDKs + log drains |
| **Query language** | SQL | Search syntax |
| **Pricing** | $0.10/GB + $0.05/GB/mo retention | $0.50/GB (5GB free) |
| **Positioned as** | Full log management | Debugging companion |
| **Trace correlation** | Automatic | Automatic |
| **Dashboards from logs** | SQL-powered, unlimited | Yes (within product limits) |
## Distributed tracing and APM
### Better Stack: eBPF, zero code changes
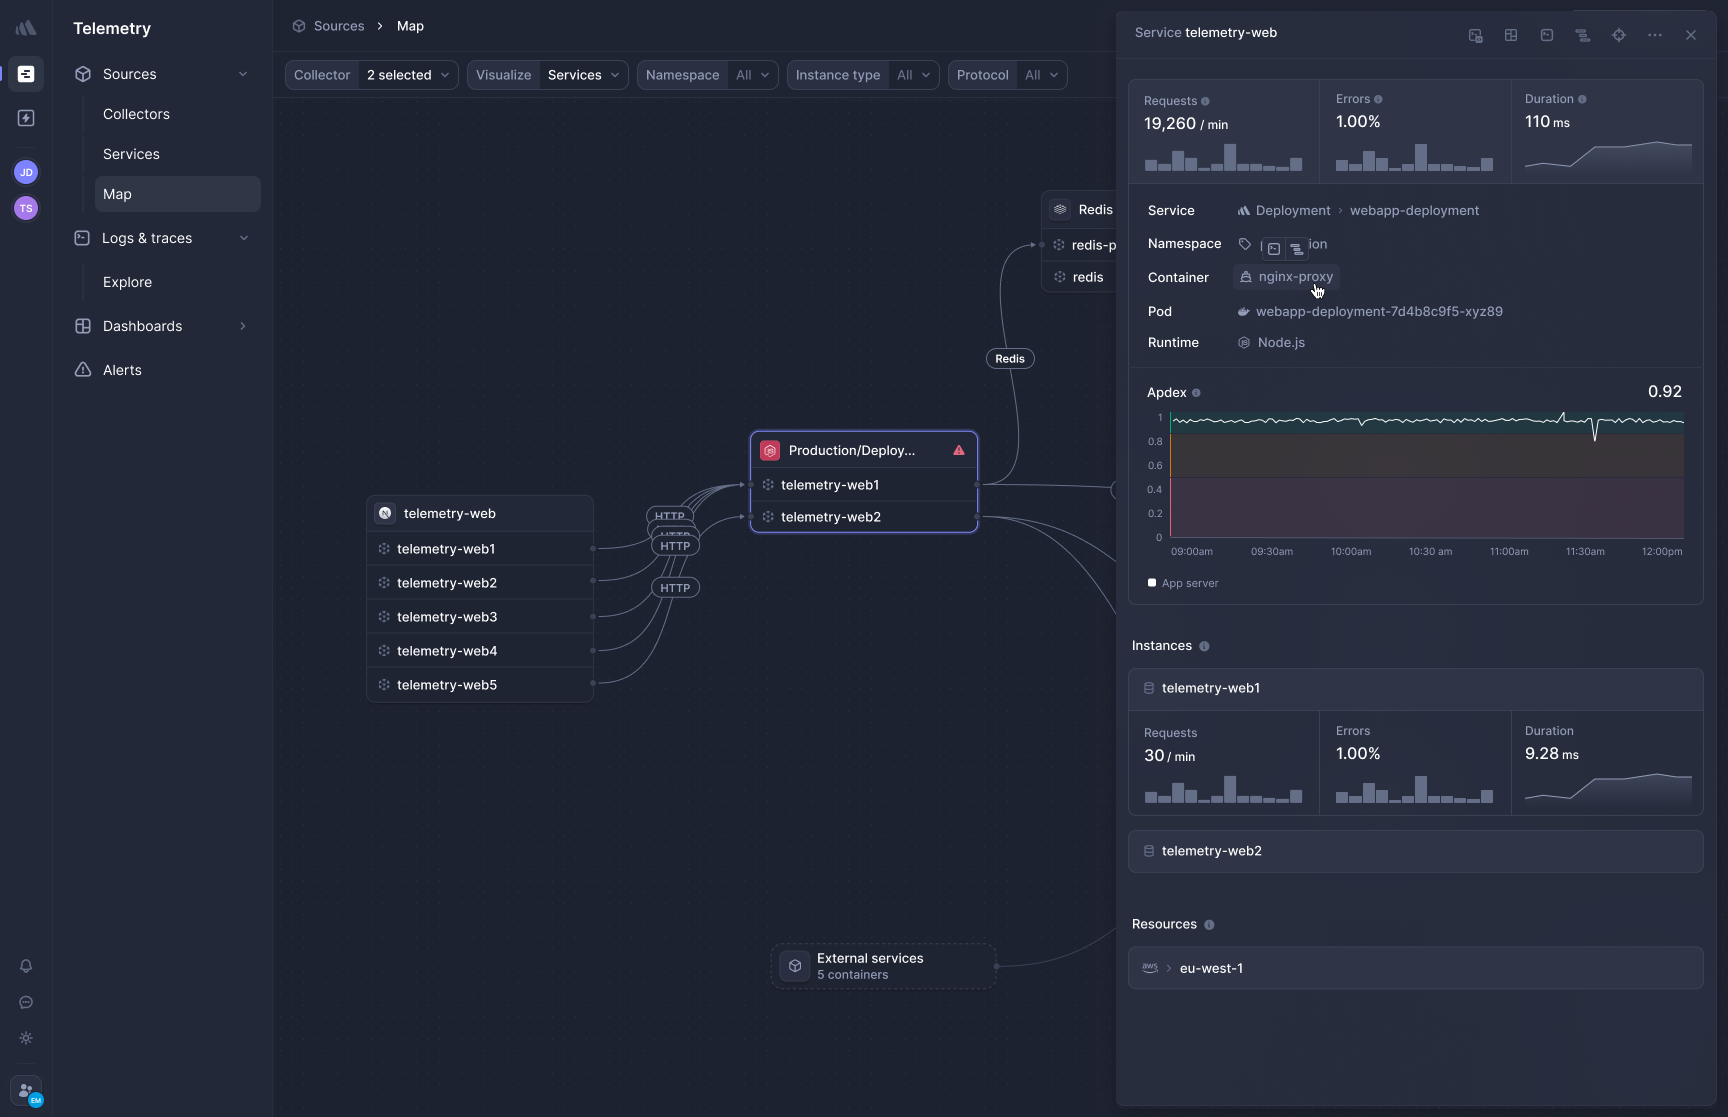
[Better Stack's APM](https://betterstack.com/tracing) captures distributed traces at the kernel level using eBPF. Deploy the collector, and HTTP, gRPC, and database traffic is captured immediately across every service on the node, including the services nobody instrumented. **Database queries to PostgreSQL, MySQL, Redis, and MongoDB appear in traces automatically.** OpenTelemetry is native, so existing OTel instrumentation plugs straight in:
### Sentry: SDK-based spans, plus profiling
Sentry's tracing is SDK-instrumented: you get spans for the code paths your SDKs cover, connected to errors and replays. Where Sentry genuinely differentiates is **continuous profiling**: production CPU profiles at the function level, telling you not just that an endpoint is slow but which function on which line is responsible. Better Stack's eBPF approach captures network-level interactions but not in-process function profiling; if that depth is central to your performance work, it's a real Sentry advantage.
The flip side: SDK-based tracing only sees what's instrumented. Uninstrumented services, third-party sidecars, and infrastructure hops are invisible. eBPF sees everything on the wire.
| Tracing / APM | Better Stack | Sentry |
|---------------|--------------|--------|
| **Instrumentation** | eBPF (zero code) + OTel | SDKs per application |
| **Coverage** | All services automatically | Instrumented services only |
| **Database tracing** | Automatic | Via SDK integrations |
| **Continuous profiling** | Network-level | Yes (function-level, differentiated) |
| **Pricing** | $0.10/GB + retention | 5M spans included, PAYG after |
## Uptime monitoring and incident management
This is where the platforms diverge most sharply, because it's where Sentry's application-centric model runs out of road entirely.
### Better Stack: the full incident lifecycle, built in
[Better Stack incident management](https://betterstack.com/incident-management) provides **unlimited phone and SMS alerts at $29/month per responder, on-call scheduling with timezone-aware rotations, multi-tier escalation policies, and Slack-native incident channels**. Here's how the full lifecycle works:
Manage incidents directly in Slack where your team already works:
Generate post-mortems automatically from incident timelines:
Uptime monitoring is a full product: HTTP, ping, TCP, DNS, and keyword checks from global locations, at $0.21/month per monitor, feeding directly into the incident pipeline. An outage detected by a monitor pages the on-call engineer, opens an incident channel, and can update the status page, all in one motion.
### Sentry: detection without response
Sentry's uptime monitoring includes one monitor on every plan, with additional monitors at $1/month, and cron monitoring catches silent job failures. These are useful additions, but they're detection features, not an incident response system. When a Sentry alert fires, delivery is email or a chat integration. There is no on-call schedule, no phone call at 2am, no escalation when the first responder doesn't acknowledge, no incident timeline, and no post-mortem generation. Every serious team running Sentry pairs it with PagerDuty or Opsgenie, which means another vendor, another bill, and another integration to maintain.
| Incident capability | Better Stack | Sentry |
|--------------------|--------------|--------|
| **Uptime monitoring** | Full product ($0.21/monitor) | Basic (1 included, $1/monitor after) |
| **Cron monitoring** | Via heartbeats | Yes (dedicated) |
| **Phone/SMS alerts** | Unlimited (included) | No |
| **On-call scheduling** | Built-in | No |
| **Escalation policies** | Multi-tier, built-in | No |
| **Incident channels** | Native Slack/Teams | No |
| **Post-mortems** | Automatic generation | No |
| **Cost (5 responders)** | $145/month | $0 + $245-415/month (PagerDuty) |
## AI capabilities
Both companies are betting hard on AI, and both have shipped real products. Honesty requires saying Seer is impressive. Completeness requires saying it costs extra and stops at the code.
### Better Stack: AI SRE and MCP server, included
**AI SRE** activates autonomously during incidents. It analyzes your service map, queries logs, reviews recent deployments, and presents a root cause hypothesis before you've finished your coffee:
Because AI SRE lives inside a platform that also owns incident management, its investigation connects directly to the response: the hypothesis lands in the incident channel, the on-call engineer is already paged, and the status page can already be updating. **[Better Stack's MCP server](https://betterstack.com/docs/getting-started/integrations/mcp/)** connects Claude, Cursor, and any MCP client to your observability data with one configuration block:
```json
{
"mcpServers": {
"betterstack": {
"type": "http",
"url": "https://mcp.betterstack.com"
}
}
}
```
Both are included in the platform. No per-contributor fees.
### Sentry: Seer, best-in-class autofix at a price
Seer is the most advanced code-fixing AI in the observability space, full stop. When an issue hits, it reads the stack trace, logs, traces, replays, commit history, and your actual source code, then proposes a fix, often as a ready-to-review pull request:
Seer Agent (2026) extends this to free-form questions, and the Sentry MCP server hands context to Claude Code and Cursor so fixes land as commits without leaving your editor:
Two caveats matter. First, **Seer costs $40/month per active contributor** on top of your plan; for a 15-contributor team that's $600/month for a capability Better Stack includes. Second, Seer's world is your application code. It cannot investigate the saturated host, the failing node, or the misbehaving load balancer, because Sentry can't see them. Seer fixes bugs. It doesn't run incidents.
| AI capability | Better Stack | Sentry |
|---------------|--------------|--------|
| **Autonomous investigation** | AI SRE (incidents, full stack) | Seer (code issues) |
| **Automated fix generation** | Root cause + context for coding agents | Yes (PRs, differentiated) |
| **Scope** | Apps + infrastructure + incidents | Application code only |
| **MCP server** | Yes (included) | Yes |
| **Connected to on-call/incidents** | Yes (native) | No |
| **Cost** | Included | $40/contributor/month |
[summary]
### AI that investigates the whole system, not just the stack trace
Seer is excellent at fixing code. Better Stack's AI SRE investigates across your services, logs, metrics, and deployments, then delivers its hypothesis into a live incident with the on-call engineer already paged.
**Autonomous root cause analysis, included in the platform.** [See the AI SRE.](https://betterstack.com)
[/summary]
## Session replay and real user monitoring
### Better Stack: unified RUM

Better Stack RUM captures frontend sessions, JavaScript errors, Core Web Vitals (LCP, CLS, INP), session replays, website analytics, and product analytics, all in the same warehouse as backend telemetry, so **frontend events are queryable with the same SQL syntax alongside your backend traces and logs**. Session replay includes rage click filtering, error-linked playback, and PII exclusion at the SDK level, at $0.00150 per replay.
### Sentry: replay built for debugging
Sentry's Session Replay is well designed for its purpose: DOM reconstruction rather than pixel recording, error-prioritized sampling so quota goes to sessions that actually reproduce bugs, aggressive privacy masking by default, and AI summaries so you can read what happened instead of watching. It covers web and mobile. What it lacks is the analytics half: no website analytics, no traffic sources, no product analytics, because Sentry's replay exists to debug issues, not to understand users.
| RUM / replay | Better Stack | Sentry |
|--------------|--------------|--------|
| **Session replay** | Yes | Yes (error-prioritized, AI summaries) |
| **Core Web Vitals** | Yes | Yes |
| **Website analytics** | Yes (referrers, UTM, real-time) | No |
| **Product analytics** | Yes | Limited |
| **Backend correlation** | Same warehouse, SQL | Trace-connected |
## Status pages and customer communication
### Better Stack: built-in status pages
[Better Stack Status Pages](https://betterstack.com/status-page) sync automatically with incident management:
Public and private pages, custom branding and domains, subscriber notifications via email, SMS, Slack, and webhooks, scheduled maintenance, multi-language support, and custom CSS.
### Sentry: no status pages
**Sentry does not include a status page product.** For a platform whose entire purpose is knowing when your application is broken, there is no built-in way to tell your customers about it. Sentry itself uses a third-party status page (status.sentry.io). You'd need Statuspage, Instatus, or Better Stack's own status pages alongside it.
## Enterprise readiness
Sentry's compliance portfolio is solid for its segment: SOC 2 on paid plans, HIPAA BAA availability, SAML and SCIM on Business and above, ISO 27001 and data residency options on Enterprise, plus a self-hosted open-source option that remains genuinely popular for teams with strict data requirements. That self-hosting path is a real Sentry advantage Better Stack doesn't offer.
Better Stack provides SOC 2 Type II, GDPR compliance, SSO via Okta/Azure/Google, SCIM provisioning, RBAC, audit logs, EU and US data residency with optional hosting in your own S3 bucket, a dedicated Slack support channel, and a named account manager.
| Enterprise feature | Better Stack | Sentry |
|-------------------|--------------|--------|
| **SOC 2 Type II** | ✓ | ✓ (paid plans) |
| **GDPR** | ✓ | ✓ |
| **HIPAA** | ✗ | ✓ (BAA) |
| **ISO 27001** | Data centers certified | Enterprise only |
| **SAML/SCIM** | ✓ | Business+ |
| **Data residency** | EU + US, optional own S3 bucket | Enterprise |
| **Self-hosted option** | ✗ (S3 data hosting optional) | ✓ (open source) |
| **Dedicated support** | Slack channel + account manager | Enterprise (TAM) |
## Final thoughts
Sentry is a genuinely great product at what it does. The error tracking is the industry's most refined, Seer is the best code-fixing AI in the space, and the developer experience that made "just add Sentry" a reflex is intact after a decade. If the entirety of your need is application-level debugging, Sentry earns its place.
But that's rarely the entirety of anyone's need. Applications run on infrastructure Sentry can't see. Incidents need people paged, escalated, and coordinated in ways Sentry doesn't attempt. Customers need status pages Sentry doesn't offer. The realistic Sentry deployment is Sentry plus PagerDuty plus a status page vendor plus an infrastructure monitoring platform: four bills, four integrations, four places for context to fall through the cracks at 3am.
**Better Stack is the right choice when you want the debugging workflow and the everything-around-it in one platform:** error tracking that accepts your existing Sentry SDKs, logs and metrics and traces in one SQL-queryable warehouse, eBPF visibility into infrastructure no SDK can reach, on-call and incident management with unlimited phone and SMS, AI SRE included rather than metered per contributor, and status pages that update while the incident is still running.
And because the Sentry SDK compatibility removes the usual migration cost, trying this claim out is unusually cheap: change a DSN, send your errors to Better Stack, and see how much further one platform takes the investigation.
Ready to see the difference? [Start your free trial](https://betterstack.com) or explore the [error tracking docs](https://betterstack.com/error-tracking) to migrate in minutes.
[summary]
### Everything Sentry does next to everything it doesn't
Error tracking with Sentry SDK compatibility, logs, metrics, traces, uptime monitoring, on-call, incident management, AI SRE, and status pages, in one platform with one volume-based bill.
**The full reliability lifecycle in one place. Start free, no credit card required.** [Try Better Stack.](https://betterstack.com)
[/summary]
---