# Better Stack vs Observe: A Complete Comparison for 2026
Choosing between these two platforms isn't as straightforward as it looks. Observe brings a purpose-built observability data lake, a proprietary Knowledge Graph, an AI SRE, and now the full weight of Snowflake behind it. Better Stack bundles logs, metrics, traces, error tracking, incident management, and status pages into one product at a price point that makes most competitors uncomfortable. **But the real question isn't which platform has the longer feature list. It's which one gets your team to root cause faster at 2am, and what the actual monthly bill looks like once you've added everything Observe doesn't include.**
Observe made a deliberate architectural bet: store all telemetry in a single data lake, stitch it together with a Knowledge Graph, and give engineers a purpose-built query language called OPAL to explore it. That bet pays off at scale. The long-term retention, the cross-signal correlation, the depth of the AI SRE investigation, these are genuine strengths. And the Snowflake acquisition in January 2026 wasn't a distress sale. It was a signal that **Observe is heading toward deeper data cloud integration, enterprise-grade governance, and a roadmap backed by one of the largest data infrastructure companies in the world.**
Better Stack went the other direction. Instead of a proprietary query layer, it bet on SQL and PromQL, languages your team already knows. Instead of manual SDK instrumentation, it uses eBPF to capture traces at the kernel level without touching your code. And instead of routing you to PagerDuty when alerts fire, it handles the full incident lifecycle in the same product. **Most teams are in production within hours, not weeks.**
This article covers both platforms honestly. Where Observe is genuinely better, it says so.
---
## Quick comparison at a glance
| Category | Better Stack | Observe |
|----------|-------------|---------|
| **Instrumentation** | eBPF (zero code changes) | OpenTelemetry agent (manual per service) |
| **Architecture** | Unified warehouse (SQL + PromQL) | Data lake with proprietary OPAL query language |
| **Query Language** | SQL + PromQL (universal) | OPAL (proprietary, purpose-built for time-series) |
| **Pricing model** | Data volume + responders | Per GiB ingested (logs $0.49, traces $0.59) |
| **Incident management** | Built-in (phone/SMS + on-call) | Not included (monitoring only) |
| **Status pages** | Built-in | Not included |
| **Error tracking** | Built-in | Not included as standalone product |
| **AI SRE** | Yes (autonomous incident investigation) | Yes (O11y AI, context graph-based) |
| **MCP server** | Yes (GA, all customers) | Yes (available) |
| **LLM observability** | Not included | Yes (dedicated product) |
| **Snowflake integration** | Third-party | Native (acquired by Snowflake Jan 2026) |
| **Integrations** | 100+ covering all major stacks: MCP, OpenTelemetry, Vector, Prometheus, Kubernetes, Docker, PostgreSQL, MySQL, Redis, MongoDB, Nginx, and more | 400+ pre-built integrations |
| **Enterprise compliance** | SOC 2 Type II, GDPR | SOC 2 Type II, GDPR |
| **Deployment time** | Hours | Days to weeks |
---
## Platform architecture
Observe and Better Stack converge on one key idea: logs, metrics, and traces should live in the same place. Beyond that, they diverge significantly on how data gets there, how it gets stored, and how engineers query it.
### Better Stack: one collector, one interface, one language
Better Stack's architecture rests on three components that stay consistent across every use case. The eBPF collector runs at the kernel level, capturing telemetry from every service without requiring code changes or SDK installation. All telemetry lands in a unified data warehouse where logs, metrics, and traces are stored as wide events. And everything is queryable through SQL or PromQL, the same syntax you already use everywhere else.
What this means in practice: when an alert fires, you see the service map, the relevant logs, the trace details, and the infrastructure metrics all in the same view. No switching products. No translating between query syntaxes. No deciding upfront which logs to index. Everything ingested is immediately searchable.
The architecture also reflects an opinion about lock-in. Better Stack is built on OpenTelemetry as a first-class standard, not an afterthought. If you decide to route data elsewhere, you change a config line, not your codebase.

### Observe: data lake with a knowledge graph
Observe's architecture is more unusual. All telemetry lands in a central data lake (built on Snowflake from day one, which is why the acquisition was a natural fit). The platform then builds a Knowledge Graph that represents relationships between your services, infrastructure components, and telemetry events. This graph is what powers Observe's AI SRE and its cross-telemetry correlation.
The query language is OPAL (Observe Processing and Analysis Language), a proprietary streaming language purpose-built for time-series and event data. OPAL is genuinely powerful for temporal queries and time-window operations that would be awkward in standard SQL. It's also a meaningful learning curve. Unlike SQL, it's not something your team already knows.
Observe positions this architecture as a strength: the Knowledge Graph enables correlation that simple co-location of data can't achieve. For teams with complex distributed systems running at very large scale, that argument has merit. The tradeoff is onboarding time, query expertise, and the dependency on a proprietary data model.

One architectural note worth calling out: Observe does not include incident management, on-call scheduling, or status pages. It is a pure observability platform. If your team needs those capabilities, you're adding another tool (PagerDuty, OpsGenie, Statuspage) and another bill on top. Have you mapped out what that stack costs before comparing Observe's headline pricing to Better Stack's?
| Architecture aspect | Better Stack | Observe |
|---------------------|--------------|---------|
| **Data collection** | eBPF (kernel-level, zero code) | OpenTelemetry agent (manual) |
| **Storage model** | Unified warehouse (all telemetry together) | Open data lake (Snowflake-based) |
| **Query language** | SQL + PromQL | OPAL (proprietary) |
| **Correlation engine** | Unified storage with automatic context | Knowledge Graph (AI-driven) |
| **Investigation flow** | Single interface, all context visible | Single interface, OPAL queries |
| **Incident management** | Built-in | Not included |
| **Time to first insights** | Minutes after deployment | Days to weeks after instrumentation |
| **OpenTelemetry support** | First-class native | First-class native |
---
## Pricing comparison
Observe's pricing is simpler than most enterprise observability tools, but it's still higher than Better Stack's volume-based model. The published starting rates are $0.49/GiB for logs, $0.59/GiB for traces, and $0.008 per DPM (data points per minute) for metrics. Observe also includes compute in these prices and charges no overage fees, which it emphasizes explicitly. Volume discounts are available through a committed subscription.
Better Stack charges $0.10/GB for log ingestion plus $0.05/GB/month retention, $0.10/GB for trace ingestion, and $0.50/GB/month for metrics. At equivalent data volumes, Better Stack is substantially cheaper on ingestion, though Observe's compute-included pricing absorbs processing costs that Better Stack handles separately.
### Better Stack: predictable, volume-based
Better Stack's pricing formula has no host counts, no cardinality penalties, and no indexing decisions. You pay for data volume, responders, and monitors. Costs scale linearly with usage. For 100GB of logs monthly: $10 ingestion + $5 retention = $15.
**Pricing structure:**
- Logs: $0.10/GB ingestion + $0.05/GB/month retention
- Traces: $0.10/GB ingestion + $0.05/GB/month retention
- Metrics: $0.50/GB/month (no cardinality penalties)
- Error tracking: $0.000050 per exception
- Responders: $29/month (unlimited phone/SMS)
- Monitors: $0.21/month each
**100-host deployment example:** ~$791/month
- Telemetry (2.5TB/month): $375
- 5 responders: $145
- 100 monitors: $21
- Error tracking (5M exceptions): $250
No high-water mark billing. No indexing fees. No separate line items for incident management or status pages.
### Observe: higher ingestion rates, compute included
Observe's published pricing reflects a different model: the per-GiB rate is higher, but compute (query processing) is bundled in rather than charged separately. The platform also guarantees no overage fees, which matters for teams that have experienced surprise bills elsewhere.
**Published starting rates:**
- Logs: $0.49/GiB ingested (compute included)
- Traces: $0.59/GiB ingested (compute included)
- Metrics: $0.008/DPM (data points per minute, 13-month retention)
- Retention beyond defaults: $0.01/GiB/month
Observe does not publish tiered plans publicly. Multi-year and volume-based discounts are available, and the company explicitly positions itself as offering "dramatically lower TCO" compared to Splunk and other high-cost vendors. Custom quotes are required for enterprise pricing, and the Snowflake relationship may change how Observe's economics work for teams already on Snowflake's data cloud.
Does your team have existing Snowflake contracts? That's worth factoring into the comparison, since Observe's deep Snowflake integration could change the effective cost for organizations already paying for that data infrastructure.
### Cost comparison: 3-year TCO (100-host deployment)
| Category | Better Stack | Observe |
|----------|-------------|---------|
| Logs + metrics + traces | $33,600 | ~$105,000+ (est., based on published per-GiB rates) |
| APM/tracing | Included | Included |
| Error tracking | $9,000 | Not included (separate tool needed) |
| Incident management | $5,220 | Not included (PagerDuty or equivalent: ~$30,000) |
| Status pages | Included | Not included (Statuspage or equivalent: ~$10,800) |
| Engineering overhead | $0 | $15,000+ (OPAL onboarding, agent instrumentation) |
| **Estimated total** | **~$47,820** | **~$160,800+** |
*Observe TCO estimate based on published per-GiB starting rates at 2.5TB/month. Actual costs may differ with volume discounts or Snowflake bundling. Contact Observe for a custom quote.*
---
## Application performance monitoring
Both platforms claim OpenTelemetry-native APM. The meaningful difference is what "native" means to each of them.
### Better Stack: eBPF-based, zero-code APM
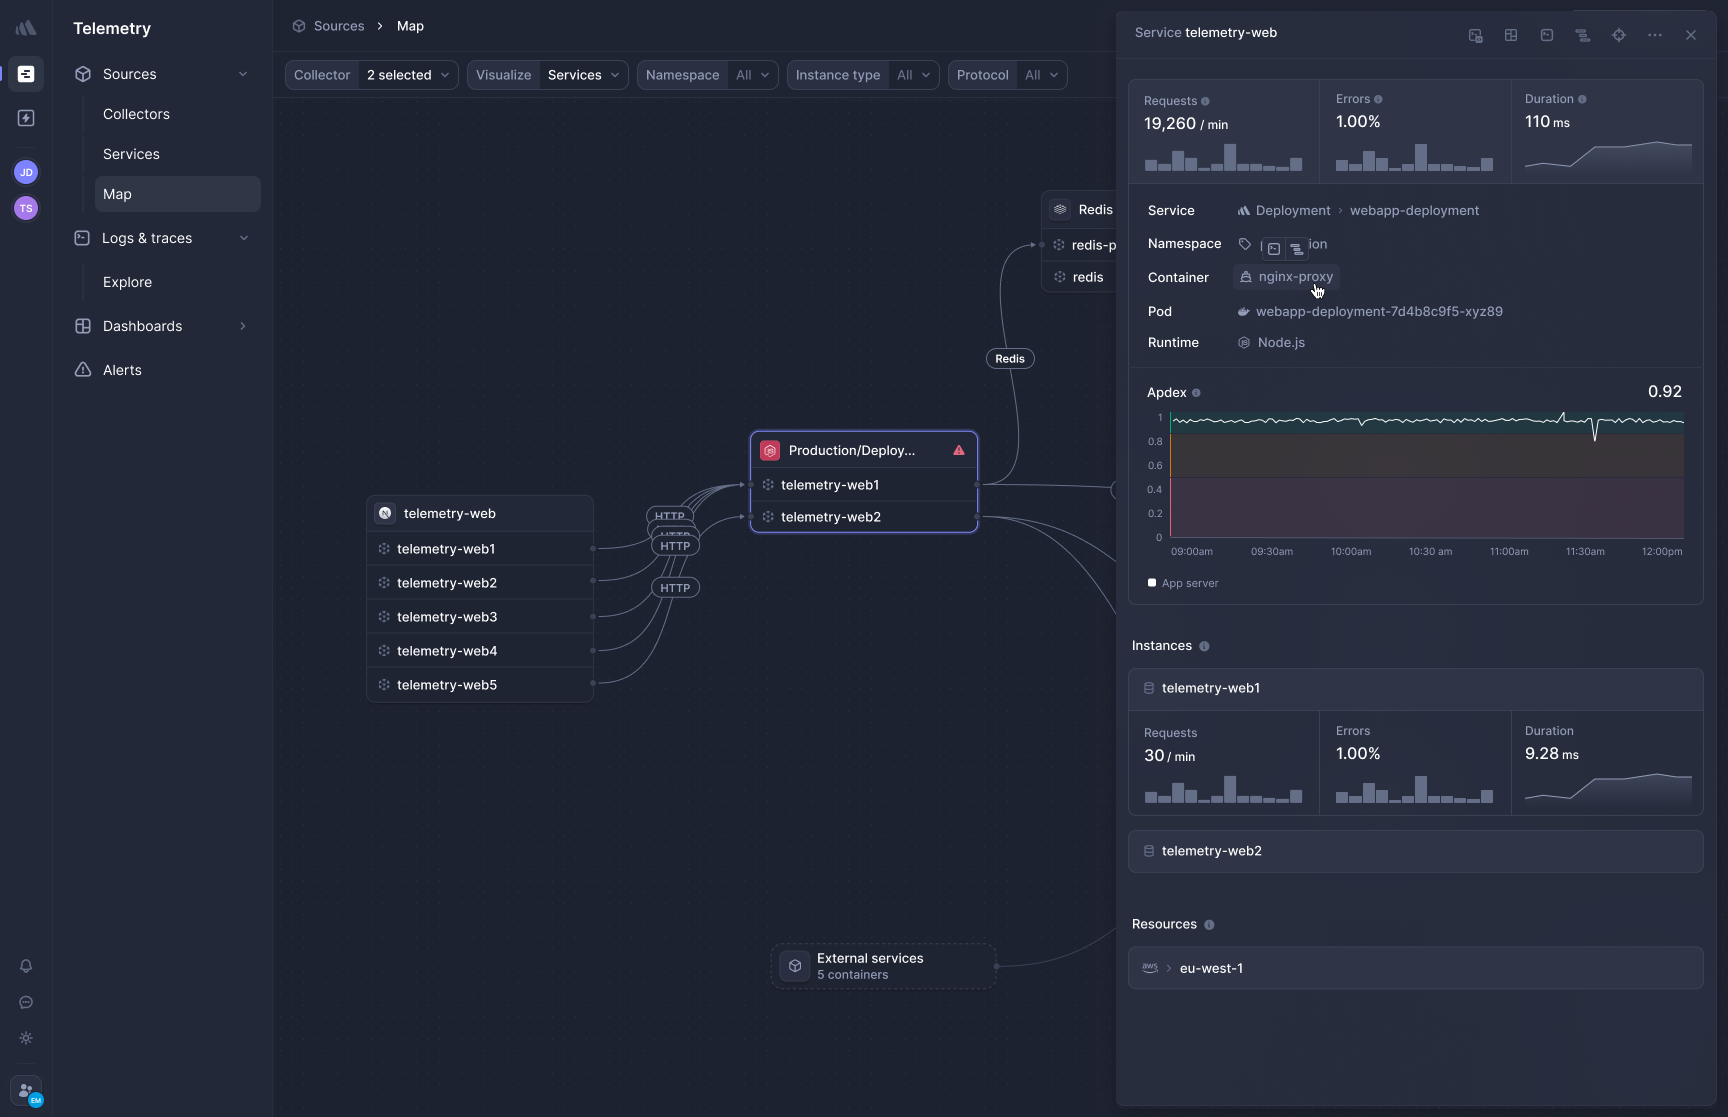
[Better Stack's APM](https://betterstack.com/tracing) captures traces at the kernel level using eBPF. You deploy the collector to Kubernetes via Helm chart and HTTP/gRPC traffic between services is traced immediately, including database calls to PostgreSQL, MySQL, Redis, and MongoDB. Nothing in your application code changes.
**Frontend-to-backend correlation** works without switching products. A slow page load traces from the browser request through every backend service and database call in a single view, using the same SQL query interface as your logs and metrics.
**OpenTelemetry-native, zero lock-in.** Your trace data is in OTel format from the start. Routing it elsewhere requires a config change, not a codebase change. In environments running Python, Go, Java, Ruby, and Node.js side by side, the absence of per-language SDK maintenance overhead is a meaningful operational advantage.
What does it cost your team to maintain separate tracing library versions across five languages? That overhead doesn't appear on any vendor invoice, but it shows up in engineering time.
### Observe: OpenTelemetry-native APM with Service Explorer
Observe built its APM directly on top of OpenTelemetry, which it describes as being the "first OpenTelemetry-native APM provider." The Observe Agent is the upstream OTel collector with no proprietary modifications, which means your instrumentation isn't tied to Observe's format.
Observe APM uses common metadata on OpenTelemetry spans to identify microservices and databases in your system, meaning no additional configuration is required when services are already instrumented with OpenTelemetry. RED metrics for each service and database are automatically created from the underlying OpenTelemetry data.
Service Explorer provides out-of-the-box service health views, deployment markers, Kubernetes infrastructure correlations, and error tracking. The deployment tracking feature is particularly strong: it correlates deployment markers with performance changes automatically, surfaces new error types introduced by releases, and lets you compare RED metrics across concurrent deployment versions including canary releases.
You can pivot seamlessly from traces to logs, metrics, and infrastructure data without the manual "stitching" that wastes hours during incidents. Drill down from service-level alerts to individual traces and correlated logs in seconds.
The instrumentation requirement is the tradeoff. Observe APM needs your services to be instrumented with OpenTelemetry SDKs. In a legacy environment or a polyglot system where some services haven't been instrumented yet, this creates a gap in coverage that Better Stack's eBPF approach sidesteps entirely. Both platforms are OpenTelemetry-native; only one of them works before you've instrumented anything.

| APM feature | Better Stack | Observe |
|-------------|-------------|---------|
| **Instrumentation** | eBPF (zero code changes) | OpenTelemetry SDKs (manual per service) |
| **Database tracing** | Automatic | Automatic (once instrumented) |
| **Frontend-to-backend** | Unified view, same interface | Integrated via correlation |
| **Deployment tracking** | Deployment markers available | Strong (canary, RED metric comparison) |
| **OpenTelemetry** | Native, no lock-in | Native, upstream OTel collector |
| **Service map** | Automatic | Automatic (Knowledge Graph-powered) |
| **Unsampled traces** | Yes | Yes (13 months retention) |
---
## Log management
The core question in log management is not what you can search, but what you can afford to keep searchable. This is where the two platforms land in very different places.
### Better Stack: 100% searchable, SQL-native
[Better Stack logs](https://betterstack.com/logs) indexes everything that comes in. There's no tiering, no archiving decision, no choosing which logs matter before an incident starts. All ingested logs are queryable via SQL immediately.
Query syntax is standard SQL:
```sql
SELECT
service_name,
COUNT(*) as error_count,
AVG(duration_ms) as avg_duration
FROM logs
WHERE level = 'error'
AND timestamp > NOW() - INTERVAL '1 hour'
GROUP BY service_name
ORDER BY error_count DESC
```
For frequently reused filters and queries, Better Stack lets you save them as presets. The Live Tail experience streams logs in real time with filtering, and the same data is immediately available for chart building and dashboard creation.
**Pricing:** $0.10/GB ingestion + $0.05/GB/month retention. 100GB monthly costs $15. No indexing fees layered on top.
### Observe: hot data lake with OPAL queries
Observe keeps all log data always hot. Search and analyze event data across your applications, infrastructure, security, or business without worrying about indexing, data tiers, retention policies, or cost. This is a genuine advantage over tiered-storage competitors like Datadog, where log archiving is a constant operational burden.
The query interface is OPAL rather than SQL. OPAL has a Query Builder for visual exploration alongside the raw language, and it's designed for streaming data with temporal operations built in. For an engineer comfortable with SQL, OPAL's learning curve runs from a few hours to a few days depending on how deeply they need to go.
Observe is designed to handle log bursts with no need for log buffers or pipelines. Ingest is automatic and scales on demand, which matters for teams running variable-load systems where log volume spikes during deployments or incident response.
The $0.49/GiB ingestion rate is approximately 5x higher than Better Stack's $0.10/GB rate at the starting tier. Volume discounts can change this calculation, and Observe's compute-included model means you're not paying separately for query processing. How much your team queries versus ingests will determine whether the effective cost difference is smaller or larger than the sticker rates suggest. And if your team is running 100GB a day rather than a month, which tier actually applies to your contract?
When was the last time your team needed a log that was sitting in cold archive storage and couldn't get to it quickly?

| Log management | Better Stack | Observe |
|----------------|-------------|---------|
| **Searchability** | 100% of ingested logs | 100% (always hot) |
| **Query language** | SQL + PromQL | OPAL (proprietary) + Query Builder |
| **Ingestion rate** | $0.10/GB | $0.49/GiB |
| **Indexing decision** | None required | None required |
| **Log bursts** | Handled automatically | Handled automatically |
| **Log-trace correlation** | Automatic | Automatic |
| **Retention** | $0.05/GB/month | $0.01/GiB/month beyond defaults |
---
## Infrastructure monitoring
Both platforms take infrastructure monitoring seriously, and both avoid the cardinality penalties that make platforms like Datadog expensive to operate at scale.
### Better Stack: volume-based, no cardinality anxiety
[Better Stack metrics](https://betterstack.com/infrastructure-monitoring) charges based on data volume, not unique metric combinations. Adding high-cardinality tags like `customer_id`, `deployment_version`, or `feature_flag` has no pricing impact. Costs stay flat relative to data volume regardless of how many unique tag combinations exist.
Better Stack supports full PromQL queries natively:
For teams that prefer visual configuration over writing queries, Better Stack also provides a drag-and-drop chart builder:
**Example PromQL metric with high cardinality:**
```promql
api_request_latency{
endpoint="/api/users",
region="us-west-2",
customer_tier="enterprise",
deployment="v2.3.1",
feature_flag="new_checkout"
}
```
100 endpoints × 5 regions × 3 tiers = 1,500 unique time series. In Better Stack, that's the same cost per GB regardless. No constraint on how you structure your tags.
### Observe: metrics from 400+ integrations
Observe captures metrics across infrastructure including cloud, Kubernetes, serverless, applications, and from over 400 pre-built integrations. It visualizes the entire stack and supports real-time troubleshooting. The 400+ integration count is Observe's specific strength here: it covers more ground out of the box than Better Stack's 100+, which matters for organizations with diverse infrastructure footprints.
Observe's metrics pricing at $0.008/DPM (data points per minute) is a different model than Better Stack's per-GB. How this translates to real costs depends heavily on your scrape interval, your number of metrics, and their cardinality. Teams with high-frequency scraping or very large metric sets will want to model this out carefully before committing. Are you currently scraping at 15-second intervals across 1,000 hosts? Run the math before assuming the published rate scales favorably.
The Kubernetes monitoring in Observe is worth calling out specifically. The platform provides out-of-the-box pod-level visualizations with automatic correlation to the logs and traces running in those pods, which is one of the more complete Kubernetes experiences in the observability market.

| Metrics feature | Better Stack | Observe |
|-----------------|-------------|---------|
| **Pricing model** | Per GB data volume | Per DPM (data points per minute) |
| **Cardinality** | No penalty | No penalty |
| **Query language** | SQL + PromQL | OPAL |
| **Integrations** | 100+ | 400+ |
| **Kubernetes monitoring** | Yes | Yes (out-of-the-box pod visualization) |
| **OpenTelemetry metrics** | Native, included | Native, included |
| **13-month retention** | Configurable | Included for metrics |
---
## AI SRE and MCP
This is an area where both platforms have invested meaningfully, and where the comparison is closer than most categories. Observe's AI SRE is built on the Knowledge Graph and has been in development since the company's founding; Better Stack's is newer but already production-ready.
### Better Stack: AI SRE and generally available MCP server
Better Stack's AI SRE activates autonomously when incidents fire. It analyzes your service map, queries recent logs, reviews deployment history, and surfaces likely root causes before anyone has to prompt it manually. The value at 3am is that you're starting from a hypothesis, not from zero.
The [Better Stack MCP server](https://betterstack.com/docs/getting-started/integrations/mcp/) is generally available to all customers. It connects Claude, Cursor, and any MCP-compatible client directly to your observability data: logs, metrics, monitors, on-call schedules, incidents, and dashboards. Your AI assistant queries Better Stack directly rather than working from copied snippets.
Setup is straightforward:
```json
{
"mcpServers": {
"betterstack": {
"type": "http",
"url": "https://mcp.betterstack.com"
}
}
}
```
You can scope what the AI assistant can access: allowlist specific read-only tools, blocklist destructive operations. The MCP server covers the full product surface: uptime monitoring, incident management, log querying, metrics, dashboards, error tracking, and on-call scheduling.
### Observe: O11y AI and MCP built on the Knowledge Graph
Observe's AI SRE leverages a unified context graph that correlates logs, metrics, and traces, allowing teams to detect anomalies earlier, identify root causes faster, and resolve production issues up to ten times faster. The Knowledge Graph is what gives Observe's AI SRE its depth: it understands the relationships between your services and can traverse them when building an investigation plan rather than pattern-matching against flat log data.
Observe's MCP server uses OPAL, Observe's query language, which enables advanced users to write queries capable of answering complex temporal questions. Rather than having agents generate OPAL directly, Observe introduced a JSON schema for representing how queries are structured, which AI agents can generate. The MCP server validates the schema and converts it to OPAL, while leveraging the Knowledge Graph for semantic correctness.
This architecture is clever: it insulates the AI agent from OPAL's learning curve while still using OPAL's power for the actual query execution. The ability to generate queries and charts based on the unique configuration of a customer's Knowledge Graph is foundational to all of Observe's AI features, which also dogfoods the MCP server internally.
Observe also has a dedicated LLM Observability product for teams monitoring AI applications, tracking token usage, latency, and cost for LLM-powered systems. Better Stack does not have an equivalent product today.
Is your team building AI agents or LLM-powered applications? Observe's LLM observability offering fills a gap Better Stack currently doesn't address.

| AI capability | Better Stack | Observe |
|--------------|-------------|---------|
| **AI SRE** | Yes (autonomous incident investigation) | Yes (Knowledge Graph-based, 10x faster claims) |
| **MCP server** | Yes (GA, all customers) | Yes (available) |
| **MCP query generation** | Direct tool calls | JSON schema to OPAL via Knowledge Graph |
| **LLM observability** | Not included | Yes (dedicated product) |
| **AI coding integration** | Claude Code + Cursor | Claude Code + Cursor |
| **Knowledge Graph** | No | Yes (service relationship modeling) |
---
## Incident management
This section covers a significant gap in Observe's product scope. Observe is an observability platform, not an incident management platform. It monitors, alerts, and investigates. When the investigation concludes that something needs to be fixed, the workflow moves outside Observe.
### Better Stack: end-to-end incident lifecycle
[Better Stack incident management](https://betterstack.com/incident-management) includes on-call scheduling, escalation policies, unlimited phone and SMS alerts, and AI-powered investigation at $29/month per responder. No additional tools required.
Incidents create dedicated Slack channels with investigation tools built in. On-call rotations are timezone-aware with automatic handoffs. Post-mortems generate automatically from incident timelines. Multi-tier escalation policies with time-based rules handle complex enterprise on-call requirements.
### Observe: monitoring and alerting only
Observe generates alerts, surfaces anomalies, and triggers the AI SRE investigation workflow. What it does not include is an on-call scheduler, phone/SMS delivery, escalation policies, or a post-mortem tool. Teams using Observe need to integrate PagerDuty ($49-83/user/month), OpsGenie, or a similar tool for the actual incident response workflow.
For 5 responders, that adds $245-415/month to the Observe stack, plus the tooling complexity of connecting alert signals from one platform to on-call management in another. This is a known tradeoff with Observe's focused product scope. If your team already has PagerDuty or has strong opinions about keeping incident management separate from observability, this may not be a problem. If you want one platform handling both, it is.
| Incident feature | Better Stack | Observe |
|-----------------|-------------|---------|
| **On-call scheduling** | Built-in | Not included |
| **Phone/SMS alerts** | Unlimited (included) | Via integration (PagerDuty, OpsGenie) |
| **Escalation policies** | Built-in, multi-tier | Via integration |
| **Slack incident channels** | Native | Via integration |
| **Post-mortems** | Automatic + manual | Not included |
| **Monthly cost (5 responders)** | $145 | $245-415 (PagerDuty) + Observe cost |
---
## Log management and deployment
How you get data into your observability platform matters more than most evaluation criteria acknowledge, because instrumentation debt compounds. Services that never get instrumented stay invisible indefinitely.
### Better Stack: deploy once, discover everything
Deploy Better Stack's eBPF collector to Kubernetes via Helm chart. The collector runs as a DaemonSet on each node and automatically discovers services, databases, and HTTP traffic. Nothing else is required.
If you're already running OpenTelemetry collectors, Better Stack integrates natively with them:
Vector pipelines, Prometheus exporters, Kubernetes, Docker, PostgreSQL, MySQL, Redis, MongoDB, and Nginx are all supported natively. The [MCP server](https://betterstack.com/docs/getting-started/integrations/mcp/) extends Better Stack's reach to Claude, Cursor, and other AI assistants.
### Observe: 400+ integrations, OpenTelemetry-first
Observe's 400+ pre-built integrations cover cloud providers, Kubernetes, serverless functions, container environments, and a long tail of infrastructure technologies. The Observe Agent is the upstream OTel collector, unmodified, which means any tool that can speak OpenTelemetry can send data to Observe without modification.
Observe can accept data from endpoints, sources, forwarders, and Datastreams, with support for OSS OpenTelemetry for teams that want to use their own OTel agent. This is a real advantage for teams with heterogeneous stacks or existing OTel investments.
The deployment requirement for APM is still manual instrumentation per service. How many services in your environment are currently uninstrumented because nobody scheduled the time to add OTel SDKs? That number represents your blind spots in Observe.
| Deployment aspect | Better Stack | Observe |
|-------------------|-------------|---------|
| **Collector deployment** | Single Helm chart | Per-service OTel instrumentation |
| **Code changes required** | Zero (eBPF) | Per service (OTel SDKs) |
| **Time to first data** | Minutes | Hours to days |
| **Integration count** | 100+ | 400+ |
| **OpenTelemetry** | Native | Native (upstream collector) |
| **Legacy service coverage** | Automatic via eBPF | Requires instrumentation |
---
## User experience and interface
Both platforms offer a single-pane-of-glass interface. The difference is in what "single pane" actually means day to day.
### Better Stack: familiar syntax, fast onboarding
Better Stack's interface uses SQL and PromQL throughout. If your team knows either of those, they're productive within hours. Log exploration, metric visualization, trace inspection, and incident management share the same interface. When an alert fires, the relevant logs, trace, and service map are visible in the same view without navigating between products.
Investigation flow: alert fires → single view with service map, related logs, metric anomalies, trace examples → click trace for details. Around 2-3 clicks from alert to root cause for most common incident types.
### Observe: OPAL depth, Query Builder for accessibility

Observe's interface is genuinely unified: logs, metrics, traces, and infrastructure all in one place, all correlated via the Knowledge Graph. The Service Explorer shows service health, deployment markers, and Kubernetes correlations in views that require no manual configuration.
OPAL is the depth layer. For users who need to write complex temporal queries, OPAL's streaming operators and time-window handling are more expressive than SQL for certain classes of problems. For users who don't want to learn OPAL, the Query Builder provides a visual interface that generates queries without writing the language directly.
Every UI action in Observe generates an OPAL equivalent, so writing code by hand doesn't replace the UI. Users can perform some operations in the UI, some in code, and some by starting in the UI and expanding in code. This is a thoughtful approach to the learning curve problem.
The honest observation is that OPAL has a real learning curve compared to SQL. Teams with senior engineers who want expressive query power will appreciate it. Teams that need fast onboarding for engineers at varying skill levels may find SQL more accessible. When you're hiring a new SRE and they need to be productive in their first week, which query language do they already know?
| UX aspect | Better Stack | Observe |
|-----------|-------------|---------|
| **Query language** | SQL + PromQL (universal) | OPAL + Query Builder |
| **Onboarding time** | Hours (SQL/PromQL familiarity) | Days to a week (OPAL learning curve) |
| **Investigation clicks** | 2-3 average | 3-5 average |
| **Interface unification** | Single product | Single product |
| **Incident management UI** | Included | Not included |
| **OPAL depth** | Not applicable | Powerful for temporal queries |
---
## LLM observability
This section covers one of Observe's genuine differentiators. Better Stack does not have an equivalent product.
### Observe: dedicated LLM observability
Observe currently offers three platforms: AI SRE, O11y.ai, and LLM Observability, with capabilities like log management, application performance monitoring, and infrastructure monitoring. The LLM Observability product monitors AI infrastructure and token usage to improve performance and costs. For teams running LLM-powered applications in production, this fills a gap that generic observability platforms don't address: tracking which models are being called, at what cost, with what latency, and how those numbers change over time.
As AI applications move from pilot to production, the operational visibility gap grows. LLM calls have unpredictable latency, variable cost per request, and failure modes (hallucination, context overflow, rate limiting) that don't look like traditional service errors. Observe's LLM Observability is designed to surface these patterns.

### Better Stack: not yet available
Better Stack does not currently include LLM observability capabilities. Teams monitoring AI applications on Better Stack use standard log and trace data from their LLM API calls, which provides partial visibility but lacks the dedicated token-level analytics Observe offers.
If LLM observability is a near-term requirement for your team, this is a meaningful gap in Better Stack's current product scope.
| LLM observability | Better Stack | Observe |
|-------------------|-------------|---------|
| **Token usage tracking** | Not included | Yes |
| **LLM cost monitoring** | Not included | Yes |
| **AI infrastructure monitoring** | Not included | Yes |
| **Model latency tracking** | Partial (via standard traces) | Yes (dedicated) |
---
## Status pages and customer communication
### Better Stack: built-in status pages
[Better Stack Status Pages](https://betterstack.com/status-pages) is included with the platform and syncs automatically with incident management.
Public and private status pages, custom branding and domains, real-time incident updates synchronized with internal incidents, subscriber notifications via email, SMS, Slack, and webhook, scheduled maintenance windows, and multi-language support are all included. Advanced features cover custom CSS, password protection, SAML SSO for private pages, and automatic incident timeline publishing.
Pricing runs $12-208/month for advanced features. For teams already on Better Stack for observability and incident management, status pages add no additional platform integration overhead.
### Observe: not included
Observe does not have a status page product. Teams using Observe for observability need a separate tool for external incident communication. Statuspage (Atlassian) starts at $79/month. Instatus, Cachet, and similar alternatives provide cheaper or self-hosted options.
This isn't a knock against Observe's focused product scope, but it is a real cost and integration requirement that doesn't appear in a direct product comparison. If you're currently evaluating tools, how many separate vendor contracts will you be managing once you've added observability, incident management, and a status page?
| Status pages | Better Stack | Observe |
|--------------|-------------|---------|
| **Availability** | Included with platform | Not included |
| **Subscriber notifications** | Email, SMS, Slack, webhook | Requires separate tool |
| **Incident sync** | Automatic | Requires integration |
| **Custom branding** | Full customization + CSS | Requires separate tool |
| **Pricing** | $12-208/month (transparent) | Separate tool ($79+/month) |
---
## Enterprise readiness
Both platforms are designed for enterprise deployment. The compliance portfolios are similar at the current level of publicly documented certifications.
Better Stack covers what most enterprise procurement requires: SOC 2 Type II, GDPR compliance, SSO via Okta, Azure, and Google, SCIM provisioning, RBAC, audit logs, and data residency options including EU and US regions with optional self-hosted storage in your own S3 bucket. Enterprise plans include a dedicated Slack support channel and a named account manager, which matters when you need a real human response during an incident, not a ticket queue.
Observe has built its enterprise capabilities on top of its Snowflake data lake heritage. SOC 2 Type II compliance, GDPR, and enterprise SSO are all included. Observe also explicitly provides an assigned Data Engineer for enterprise customers, which goes beyond typical account management into active hands-on assistance. The Snowflake acquisition may expand Observe's compliance portfolio over time, especially for customers in regulated industries where Snowflake already has established certifications.
Neither platform currently carries HIPAA or FedRAMP certification. If you're in healthcare or federal government, both platforms require evaluation against those requirements separately.
| Enterprise feature | Better Stack | Observe |
|-------------------|-------------|---------|
| **SOC 2 Type II** | ✓ | ✓ |
| **GDPR** | ✓ | ✓ |
| **HIPAA** | ✗ | ✗ |
| **FedRAMP** | ✗ | ✗ |
| **SSO (SAML/OIDC)** | ✓ (Okta, Azure, Google) | ✓ |
| **SCIM provisioning** | ✓ | ✓ |
| **RBAC** | ✓ | ✓ |
| **Audit logs** | ✓ | ✓ |
| **Data residency** | EU + US, optional S3 bucket | Data lake (Snowflake-based) |
| **Dedicated support** | Slack channel + account manager | Assigned Data Engineer |
| **SLA** | Enterprise SLA available | Enterprise SLA available |
| **Self-hosted data** | Optional (your S3 bucket) | Snowflake data lake |
| **Snowflake integration** | Third-party | Native (acquired by Snowflake) |
### Enterprise checklist
| Requirement | Better Stack | Observe |
|-------------|-------------|---------|
| SSO/SAML | ✓ | ✓ |
| SCIM user provisioning | ✓ | ✓ |
| Role-based access control | ✓ | ✓ |
| Audit logs | ✓ | ✓ |
| Data residency options | ✓ | ✓ |
| Dedicated support channel | ✓ (Slack) | ✓ (Data Engineer) |
| Named account manager | ✓ | ✓ |
| Enterprise SLA | ✓ | ✓ |
| Incident management included | ✓ | ✗ |
| Status pages included | ✓ | ✗ |
---
Here's the rewritten final thoughts section:
---
## Final thoughts
The choice really comes down to three things: **what your team needs beyond pure observability, which query language you want engineers writing at 2am, and how tied your infrastructure future is to Snowflake.**
Observe is a genuinely excellent observability platform. The Knowledge Graph-powered AI SRE, the dedicated LLM observability product, the 13 months of unsampled trace retention, and the Snowflake-native architecture give it real advantages for large engineering teams running complex distributed systems. The acquisition wasn't a footnote. It was Snowflake making a $1B bet that observability belongs inside the data cloud, and that changes Observe's long-term trajectory in ways that matter if you're already a Snowflake shop.
But **Observe stops at the incident boundary.** When a page goes down, you still need PagerDuty for the phone call, Statuspage for the customer-facing notice, and something else for the post-mortem. Those integrations work fine. They also add three more vendor relationships, three more bills, and three more things to break during the incident you're trying to resolve.
Better Stack handles that entire lifecycle inside one product. The eBPF collector means you don't coordinate SDK rollouts across teams to get visibility. SQL and PromQL mean a new hire is writing useful queries on day one. And at roughly **one-third to one-fifth the per-GiB ingestion cost of Observe**, the pricing is hard to argue with.
Pick Observe if your organization is already running on Snowflake, if LLM observability is a current requirement, or if your distributed system is large and complex enough that the Knowledge Graph's depth of correlation is genuinely worth the instrumentation work and the OPAL learning curve.
Pick Better Stack if you want **one platform handling observability, incident response, and status pages** without stitching together a tool stack, and you want to be in production today rather than next sprint.
[Start your free trial](https://betterstack.com) and have logs, metrics, traces, incident management, and status pages running before end of day.