# Better Stack vs IBM Instana: A Complete Comparison for 2026
IBM Instana stands out as one of the more technically ambitious APM platforms today. It was early to **automatic, agent-based instrumentation**, and its commitment to **capturing 100% of requests with no sampling** remains a real differentiator. That level of visibility is impressive.
At the same time, Instana is still fundamentally an **APM product shaped by IBM’s enterprise model**. It is often sold into organizations already aligned with IBM, with pricing and packaging that reflect that environment.
**Better Stack takes a broader approach.** It delivers **logs, metrics, traces, error tracking, incident management, and status pages in one platform**, without per-host licensing or layered pricing for core features. The underlying instrumentation philosophy is similar, both platforms auto-discover services, trace requests, and capture database activity without code changes. The difference is what comes after APM.
Beyond tracing, **Instana’s coverage becomes more limited**, while **Better Stack extends into full-stack observability and incident response**. The contrast is also clear in pricing, where Instana’s MVS model can be harder to predict as systems scale.
This comparison looks at both platforms honestly. **Instana is a strong fit for teams deeply invested in IBM ecosystems or needing mainframe-to-microservices visibility.** For most other teams, the trade-offs around scope, pricing, and flexibility are worth evaluating carefully before committing.
## Quick comparison at a glance
| Category | Better Stack | IBM Instana |
|----------|-------------|-------------|
| **Instrumentation** | eBPF (zero code changes) | Agent-based (auto-discovery, some sensors) |
| **Trace sampling** | Configurable | 100% unsampled by default |
| **Metrics granularity** | Sub-second | 1-second |
| **Pricing model** | Data volume + responders | Per MVS (Managed Virtual Server) |
| **Minimum commitment** | None | 10 MVS licenses |
| **Incident management** | Built-in, unlimited phone/SMS | Via integrations (PagerDuty, Slack, etc.) |
| **Status pages** | Built-in | Not included |
| **Error tracking** | Built-in | Not included |
| **OpenTelemetry** | Native, first-class | Supported alongside proprietary sensors |
| **Self-hosted option** | Optional (your S3 bucket) | Yes (on-prem or private cloud) |
| **AI investigation** | AI SRE, MCP server (GA) | Agentic AI investigation (GA) |
| **Mainframe support** | ✗ | IBM Z / z/OS monitoring |
| **Enterprise compliance** | SOC 2 Type II, GDPR | SOC 2, GDPR, FedRAMP |
## Platform architecture
Both platforms took the same early bet: automatic instrumentation should not require developers to rewrite their services. But they arrived at that goal through different mechanisms, and those mechanisms produce meaningfully different architectural outcomes.
### Better Stack: eBPF-based unified observability
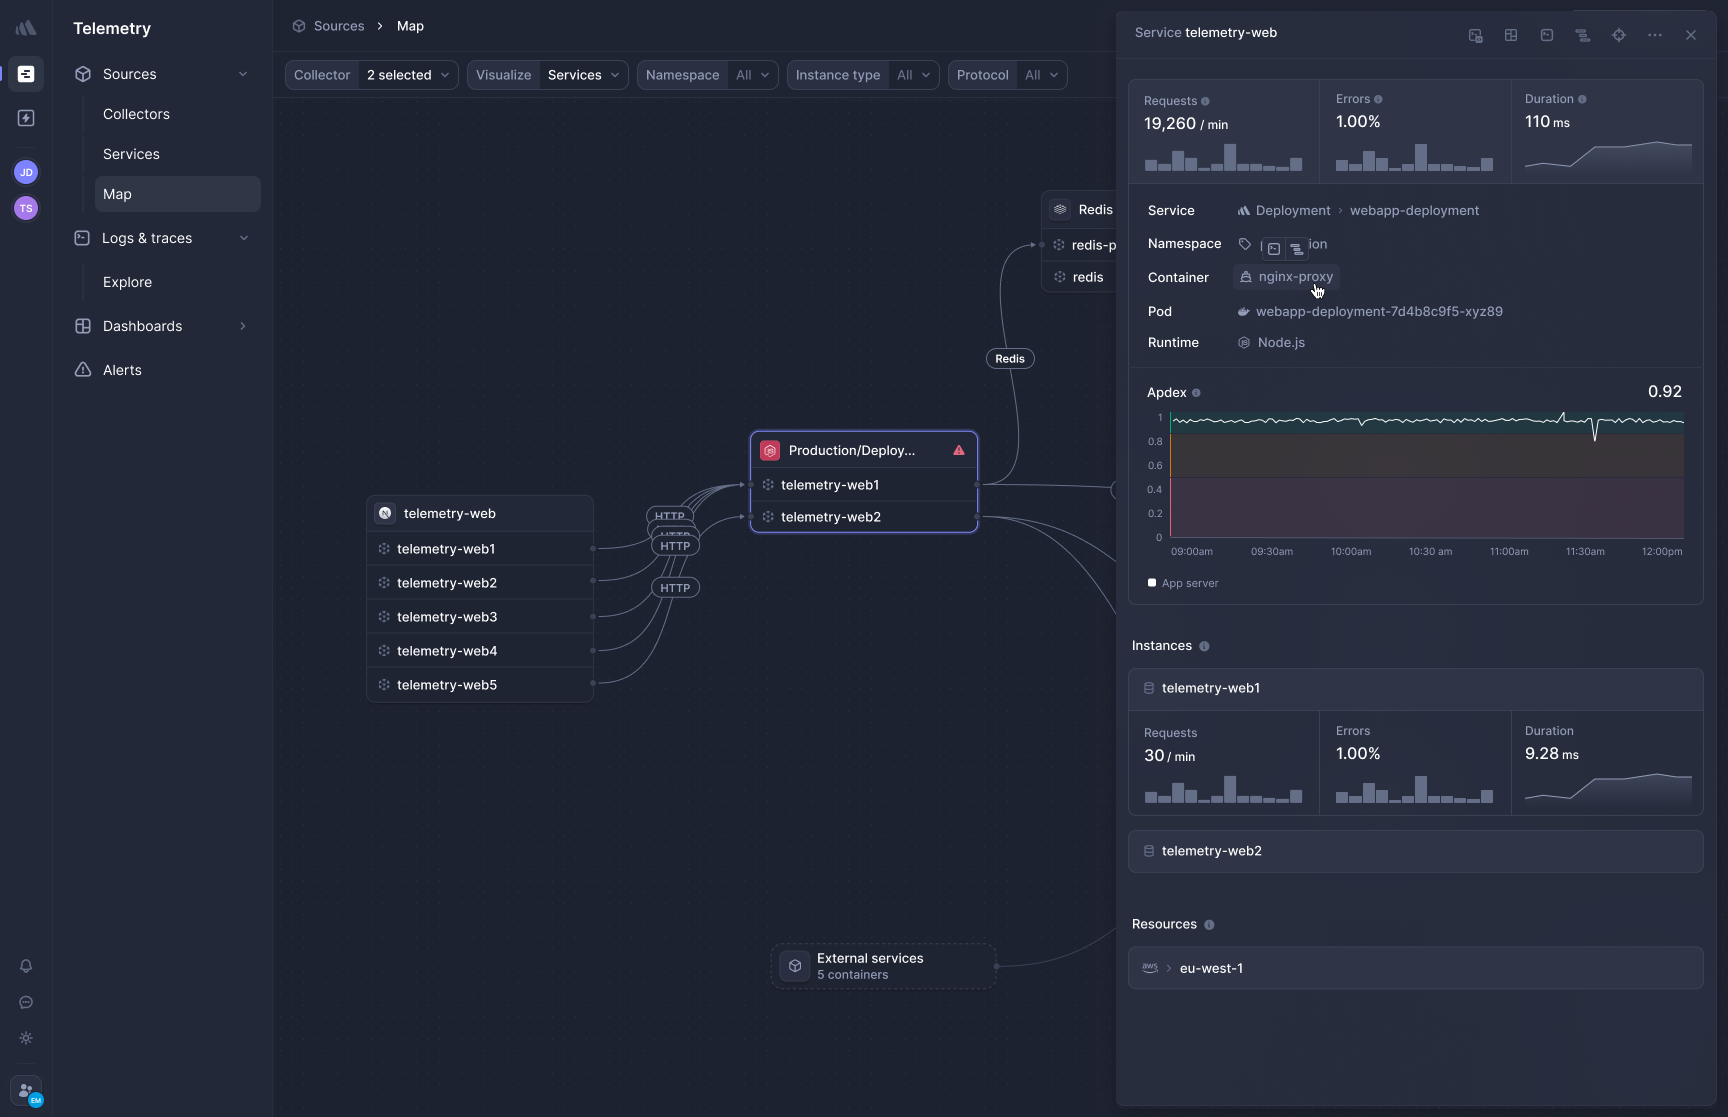
Better Stack operates at the Linux kernel level using eBPF, which means the collector sees all network traffic between services without touching the application process at all. No sensor files to maintain per technology, no agent memory overhead inside your containers, no version pinning per language runtime. The collector runs as a DaemonSet on Kubernetes nodes and automatically discovers services, database calls, and inter-service HTTP/gRPC traffic from the outside in.
The architecture is unified in a specific sense: logs, metrics, and traces all land in the same ClickHouse data warehouse and are queryable with the same SQL or PromQL syntax. **An alert fires, you open one view, and the relevant logs, metrics, and traces are already there.** No product switching, no mental context shift between different query languages.

OpenTelemetry is not an add-on here. It is the native wire format. If you are already shipping traces from your services via OTel, you point the exporter at Better Stack and you are done. No proprietary SDK required, no pricing penalty for using the open standard.
### IBM Instana: agent-based auto-discovery with Dynamic Graph

Instana's approach to automatic instrumentation is agent-based: a single agent binary runs on each host and deploys technology-specific sensors automatically when it detects a supported runtime or database. You install the agent once, and it discovers Java, Node.js, Python, Go, .NET, PHP, and 300+ other technologies without you configuring each one. This is more invasive than eBPF (there is an agent process running alongside your workloads) but gives Instana something Better Stack cannot fully match: code-level visibility into function call stacks.
The Dynamic Graph is Instana's real architectural differentiator. It models every application component and its relationships in real time, updating continuously as services start, stop, and change. When an incident fires, Instana already has a live map of which components are connected, which upstream changes occurred, and which downstream services are affected. The correlation is structural, not just temporal.
**100% unsampled tracing** is Instana's most distinctive technical claim. While most APM tools, including Better Stack in certain configurations, apply sampling to control storage costs, Instana captures every single request at 1-second granularity. For teams in financial services or healthcare where audit requirements demand complete trace records, this matters.
The tradeoff is that Instana's architecture is APM-first. Log management is available but is not the core product. Incident management is handled via integrations with PagerDuty, Slack, ServiceNow, and OpsGenie rather than built in. Status pages do not exist. Error tracking is not a standalone product. If APM is your primary need and you accept routing other workflow components to third-party tools, Instana's architecture is well-matched. If you want everything in one place, you will end up patching together Instana plus external tools.
| Architecture aspect | Better Stack | IBM Instana |
|---------------------|--------------|-------------|
| **Instrumentation method** | eBPF (kernel-level, zero code) | Agent + sensors (per-technology) |
| **Service discovery** | Automatic | Automatic |
| **Trace sampling** | Configurable | 100% unsampled |
| **Metrics granularity** | Sub-second | 1-second |
| **Data model** | Unified warehouse (SQL/PromQL) | Dynamic Graph (proprietary) |
| **Query language** | SQL + PromQL | Tag-based filter UI + API |
| **Log management** | Core product | Add-on (ingestion-based) |
| **Self-hosted data** | Optional (your S3 bucket) | Yes (on-prem or private cloud) |
| **Code-level profiling** | Network-level only | Yes, per-process via sensors |
## Pricing comparison
This is where the two platforms diverge most sharply, and where teams often discover that Instana's "flat-rate pricing" tagline needs more unpacking than the marketing suggests.
### Better Stack: volume-based with no minimums
Better Stack prices on data volume, not on host or server count. You pay for GB ingested and GB stored. No minimum license quantity, no per-feature add-ons for things like incident management or error tracking, no cardinality multipliers.
**Pricing structure:**
- Logs: $0.10/GB ingestion + $0.05/GB/month retention (all searchable, no indexing fees)
- Traces: $0.10/GB ingestion + $0.05/GB/month retention
- Metrics: $0.50/GB/month (no cardinality penalties)
- Error tracking: $0.000050 per exception
- Responders: $29/month (unlimited phone/SMS included)
- Monitors: $0.21/month each
**100-host deployment example:** approximately $791/month
- Telemetry (2.5TB/month): $375
- 5 Responders: $145
- 100 Monitors: $21
- Error tracking (5M exceptions): $250
Incident management, status pages, and error tracking are included in this number. No separate PagerDuty contract required.
### IBM Instana: MVS-based licensing
Instana offers a cloud pricing model of $21.20 per MVS per month for Essentials and $79.50 per MVS per month for Standard SaaS, with a self-hosted option at $120.00 per MVS per month. The fair use data ingestion policy provides 325 GB per Standard SaaS MVS per month and 50 GB per Essentials SaaS MVS per month.
An MVS (Managed Virtual Server) maps roughly to a host, virtual server, or Kubernetes worker node. The minimum order requires subscribing to at least 10 Essentials and 10 Standard MVS licenses, and thereafter you can purchase additional MVS licenses of either type.
**What's included in Standard:** APM, distributed tracing, infrastructure monitoring, digital experience monitoring (RUM), and synthetic tests. Log management is available as an ingestion-based add-on with flexible retention options of 30, 60, or 90 days.
**100-host deployment example (Standard SaaS):** approximately $7,950/month
- 100 MVS at $79.50: $7,950
- Log ingestion (if used): additional per GB
- Incident management tooling (PagerDuty/OpsGenie): additional
That figure excludes log management costs and any third-party on-call tooling. For the equivalent Better Stack deployment including incident management, status pages, and error tracking, you are looking at $791/month, roughly a 10:1 cost difference.
The self-hosted option at $120/MVS is counterintuitively more expensive than SaaS, reflecting the operational overhead IBM assumes when you run your own infrastructure. Teams with strict data sovereignty requirements often end up here, which compounds cost. Is paying 50% more per host the right price for on-prem control, or is it a signal that the pricing model was not designed with self-hosted teams in mind?
### 3-year TCO comparison (100 hosts)
| Category | Better Stack | IBM Instana Standard SaaS |
|----------|-------------|--------------------------|
| Platform (logs, metrics, traces) | $13,500 | $285,420 |
| APM/Tracing | Included | Included in MVS |
| Error tracking | $9,000 | Not included |
| Incident management | $5,220 | $21,600+ (PagerDuty) |
| Status pages | Included | Not available |
| Engineering overhead | $0 | Moderate (agent management) |
| **Total (3 years)** | **$27,720+** | **$307,020+** |
Better Stack's 3-year total is approximately 90% lower. The primary driver is not features or architecture; it is the fundamental difference between per-GB pricing and per-host licensing at $79.50/host/month.
## Application performance monitoring and distributed tracing
APM is where Instana is strongest. This is the product's origin, and IBM has invested heavily in keeping it technically differentiated. The comparison here is more competitive than in any other section.
### Better Stack: eBPF tracing with full-stack correlation
[Better Stack's APM](https://betterstack.com/tracing) captures distributed traces at the kernel level using eBPF. Deploy the collector to Kubernetes and HTTP/gRPC traffic between your services is traced immediately, without any developer touching a single service.
Database calls to PostgreSQL, MySQL, Redis, and MongoDB are automatically captured and included in the trace. **Frontend-to-backend correlation** shows you exactly what was happening across your backend services when a user experienced a slow page load, all in a single view without switching between products or manually stitching context.
**OpenTelemetry-native, zero lock-in.** Better Stack accepts OTel data natively and does not charge a premium for it. Your instrumentation is portable: if you want to send the same traces to a different backend next year, you change one line in your collector config. No SDK migration, no re-instrumentation. What would it cost your team to migrate away from a proprietary tracing format today? That number grows every month you stay on one.
**Polyglot environments** are where zero-code instrumentation matters most. When you have Python, Go, Ruby, and Java services running side by side, maintaining per-language tracing libraries, keeping them updated, and debugging version conflicts adds real overhead that eBPF eliminates entirely.
### IBM Instana: agent-based APM with 100% capture and code-level visibility

Instana traces transactions across different components of an application, providing insights into the performance of individual components and how they interact, with a detailed context so that all required data for troubleshooting is available.
The technical differentiator Instana holds over Better Stack in APM is genuine: unlike competitors that sample traces, Instana captures 100% of all requests in real-time, ensuring complete visibility into application performance. For teams where a missed trace could mean missing a compliance violation or a billing error, this matters.
Instana's full open telemetry support delivers a unified view of telemetry data and provides value-added capabilities through Instana's powerful dependency map and full-stack visibility. The Dynamic Graph builds a continuously updated model of all service relationships, so when something breaks, Instana already knows which components depend on which others and shows you the propagation path.
Code-level profiling is available through Instana's language sensors, showing you which functions are consuming CPU and where memory allocations occur. This is deeper than what eBPF can surface at the network level.
The limitations are also real. The agent runs as a separate process on each host, consuming memory and CPU. G2 reviewers note the platform can feel "feature dense" and overwhelming for new team members, and some reviewers flag Terraform integration as unreliable. Logs are not a first-class product, which means correlating a trace with the surrounding log context requires more configuration than in Better Stack.
| APM feature | Better Stack | IBM Instana |
|-------------|--------------|-------------|
| **Instrumentation** | eBPF (zero code, kernel-level) | Agent sensors (auto-deploy per technology) |
| **Trace completeness** | Configurable sampling | 100% unsampled by default |
| **Database tracing** | Automatic (Postgres, MySQL, Redis, Mongo) | Automatic (300+ technology sensors) |
| **Code-level profiling** | Network-level only | Yes, per-process function profiling |
| **Frontend-to-backend** | Unified view, same interface | RUM + APM correlation (built-in) |
| **OpenTelemetry** | Native, no premium | Supported alongside proprietary sensors |
| **Dependency mapping** | Service maps | Dynamic Graph (real-time, structural) |
| **Mainframe tracing** | ✗ | IBM Z / z/OS end-to-end |
## Infrastructure monitoring
Both platforms monitor infrastructure without requiring you to write configuration files for every service. The difference is in how they price the data they collect.
### Better Stack: cardinality-safe metrics with PromQL
[Better Stack metrics](https://betterstack.com/infrastructure-monitoring) charges based on data volume, so you can tag metrics with as much granularity as your analysis requires without worrying that a high-cardinality tag will multiply your bill overnight.
Full PromQL support means you can run the same queries you use in Prometheus without learning a new syntax. If you prefer a visual approach to building metric charts, Better Stack's drag-and-drop builder works without writing any query at all.
OpenTelemetry metrics are treated identically to any other metric. No "custom metrics" category, no separate pricing tier, no incentive to use a proprietary format instead of the open standard.
### IBM Instana: real-time infrastructure with Dynamic Graph correlation

IBM Instana Observability delivers AI-powered automated monitoring, alerting, and remediation capabilities for real-time visibility into distributed infrastructure components, providing automatic correlation of all performance, health, event, and configuration information.
Each block within a pillar represents the software components running on that system. Any deviation in the performance of a component is reflected by a change in the color of that pillar. This visual model is one of Instana's most praised UI elements in user reviews: it makes it immediately obvious which hosts have degraded components and where in the stack the degradation originates.
The infrastructure monitoring capability is included in the MVS license, which removes the common frustration of infrastructure costs stacking on top of APM costs. But remember that the MVS unit maps to virtual servers: more hosts means more MVS licenses, which means the infrastructure monitoring cost scales with your fleet regardless of how much data you actually generate. If you have bursty infrastructure that scales up and down frequently, you are paying for peak capacity all month.
Instana provides end-to-end monitoring capabilities for IBM z/OS, which is a genuine capability gap Better Stack does not address. For organizations running mainframe workloads alongside modern microservices, Instana's ability to surface z/OS performance data in the same interface as Kubernetes pod metrics has real value.
| Infrastructure feature | Better Stack | IBM Instana |
|-----------------------|--------------|-------------|
| **Pricing model** | Data volume | Per MVS (per host) |
| **Cardinality** | No penalty | Included in MVS |
| **PromQL support** | Native | Prometheus integration supported |
| **OpenTelemetry metrics** | First-class | Supported alongside native collection |
| **Real-time updates** | Sub-second | 1-second granularity |
| **Mainframe / z/OS** | ✗ | ✓ |
| **Visual health model** | Service maps, dashboards | Dynamic Graph with color-coded pillars |
## Log management
Log management is where the gap between the two platforms is most significant. For Instana, logs are an add-on to an APM product. For Better Stack, logs are the foundation the entire product is built on.
### Better Stack: logs as a first-class data type
[Better Stack logs](https://betterstack.com/logs) treats every ingested log as a structured event in the same data warehouse as your traces and metrics. All logs are searchable immediately after ingestion. There is no indexing tier, no decision about which logs matter, no 30-day wait to rehydrate an archive when you need a log that was never indexed. **When an incident fires at 3am, every log you have ever ingested is available for querying right now.**
SQL queries across log data are familiar to any developer:
```sql
SELECT
service_name,
COUNT(*) as error_count,
AVG(duration_ms) as avg_duration
FROM logs
WHERE level = 'error'
AND timestamp > NOW() - INTERVAL '1 hour'
GROUP BY service_name
ORDER BY error_count DESC
```
**Pricing:** $0.10/GB ingestion + $0.05/GB/month retention. A service producing 100GB monthly costs $15 total. Log costs are predictable because they track actual data volume, not usage patterns or indexing decisions made months earlier.
### IBM Instana: log ingestion as a paid add-on

IBM Instana includes log ingestion from any source with flexible retention options of 30, 60, or 90 days. Log management is priced separately from the MVS license, which means your Instana contract covers APM, infrastructure, and RUM, but logs require additional negotiation.
G2 reviewers specifically note the reliance on OpenTelemetry for logging as a pain point: one reviewer described the setup as harder to maintain "compared to the magic of Instana's automatic tracing sensors." The core product's auto-instrumentation magic does not extend to log collection the same way. You end up configuring log pipelines manually, which is the opposite of the zero-configuration experience Instana markets elsewhere.
What does the log correlation story look like when logs are not a first-class citizen? You get linked views from a trace to associated logs if the correlation context is present, but the log data may not be there if your log retention is set to 30 days and the incident happened 35 days ago. Better Stack retains all ingested logs per your configured retention with no restriction on what is searchable.
How often do you find yourself investigating an incident and realizing the logs you need were never indexed, already purged, or available only at extra cost? That experience disappears when logs are treated as equal-priority telemetry.
| Log management | Better Stack | IBM Instana |
|----------------|--------------|-------------|
| **Product status** | Core product | Add-on (separate pricing) |
| **Searchability** | 100% of ingested logs | Yes, within retention window |
| **Retention options** | Configurable | 30, 60, or 90 days |
| **Query language** | SQL + PromQL | Filter-based UI |
| **Trace correlation** | Automatic | Available (requires configuration) |
| **Real-time streaming** | Live Tail with SQL filtering | Available |
| **Pricing** | $0.10/GB ingestion + $0.05/GB storage | Separate from MVS license |
## Incident management
Instana's incident workflow is built around SmartAlerts and integrations with third-party tools. Better Stack includes the entire on-call stack in one bill. If you are currently running Instana and routing alerts to PagerDuty, you already know what that integration costs.
### Better Stack: on-call and incidents built in
[Better Stack incident management](https://betterstack.com/incident-management) includes unlimited phone and SMS alerts, on-call scheduling, escalation policies, and Slack-native incident channels at $29/month per responder. There is no second tool to configure, no second contract to renew, and no bill shock when PagerDuty raises prices.
On-call rotations are timezone-aware with automatic handoffs:
Post-mortems are generated automatically from incident timelines:
### IBM Instana: SmartAlerts with third-party on-call routing

Instana provides SmartAlerts powered by AI and machine learning, with an in-depth incident report that correlates all corresponding events using the Dynamic Graph, resulting in a single alert containing an effect report with details to enable rapid incident resolution.
The alerting quality is genuinely good. SmartAlerts learn normal behavior from your services and reduce alert fatigue by correlating related events into single actionable notifications. The Dynamic Graph context means each alert already includes knowledge of which other components are affected.
What Instana does not include is the delivery layer: actual phone calls, SMS, on-call scheduling with rotations, and escalation policies. Those are handled via integrations with PagerDuty ($49-83/user/month), OpsGenie, or ServiceNow. For 5 responders on PagerDuty Professional, that is $245-415/month on top of your Instana contract. Better Stack handles all of that for $145/month (5 responders at $29 each).
There is no incident management gap if you are already paying for PagerDuty and satisfied with it. But if you are evaluating your total observability spend, the integration pattern means you are maintaining two vendor relationships instead of one.
| Incident feature | Better Stack | IBM Instana |
|------------------|--------------|-------------|
| **Alert intelligence** | Threshold + anomaly detection | SmartAlerts (ML-based, Dynamic Graph) |
| **Phone/SMS delivery** | Unlimited (included) | Via PagerDuty/OpsGenie |
| **On-call scheduling** | Built-in with rotations | Via third-party tools |
| **Slack incidents** | Native channels with tools | Slack integration for alert delivery |
| **Post-mortems** | Auto-generated from timeline | Manual or via ServiceNow |
| **Monthly cost (5 responders)** | $145 | $245-415+ (PagerDuty) |
## Digital experience monitoring
Both platforms call this "digital experience monitoring" or DEM: the combination of real user monitoring, synthetic testing, and mobile app performance. Instana has had this capability longer. Better Stack's RUM product is newer but deeply integrated.
### Better Stack: unified RUM with same-query-language correlation

Better Stack RUM captures frontend sessions, JavaScript errors, Core Web Vitals, and user behavior analytics, all stored in the same ClickHouse warehouse as your backend traces. That means a session replay, a JavaScript error, and the distributed backend trace that caused it are all visible in one place, queryable with SQL, without configuring correlation between separate products.
Session replay includes controls to filter by rage clicks, dead clicks, and errors. **Website analytics** tracks referrers, UTM campaigns, entry and exit pages, and user agents in real time, so a traffic spike from a ChatGPT mention shows up next to the backend load it generates. Web vitals (LCP, CLS, INP) are tracked per URL with alerting when a deploy degrades performance.
Error tracking is built into RUM. When a user hits a bug, you see the replay, the JavaScript stack trace, and the backend distributed trace in one view, with one-click Claude Code prompts to start debugging immediately.
**Pricing:** approximately $102/month for 5M web events and 50,000 session replays.
### IBM Instana: DEM with synthetic monitoring and mobile support

By combining RUM and synthetic monitoring data, IBM Instana provides a digital experience monitoring tool for optimizing user journeys. IBM Instana has won the G2 Winter 2026 awards for being a DEM Overall, Mid-market, SMB, and Momentum Leader.
Instana supports both real user monitoring and synthetic monitoring: tracking real user page loads, errors, and performance by browser, geography, and device, while running synthetic tests to continuously monitor key user journeys.
Instana's DEM capability includes mobile app monitoring for iOS and Android, which is a genuine differentiator Better Stack's RUM does not match today. If mobile performance is a primary requirement, that gap matters. The synthetic monitoring capability, which executes scripted tests from multiple global locations to check availability and performance, is available on the Standard plan and not on Essentials.
Automatic distributed tracing accelerates root cause determination, and agentic AI capabilities hasten incident investigation to help teams proactively solve performance issues across endpoints, user devices, and user journeys.
The frontend-to-backend correlation in Instana requires both the RUM and APM sensors to be active and configured together, but once set up, clicking from a slow frontend session into the backend trace that caused it is seamless. It does require the full Instana agent and sensor deployment, so there is no shortcut to getting this correlation if your APM instrumentation is incomplete.
| DEM feature | Better Stack | IBM Instana |
|-------------|--------------|-------------|
| **Web RUM** | Yes | Yes |
| **Mobile RUM** | Web only (mobile coming) | iOS, Android |
| **Session replay** | Yes | Yes |
| **Synthetic monitoring** | Via uptime checks | Yes (Standard plan, global locations) |
| **Core Web Vitals** | LCP, CLS, INP | Yes |
| **Frontend-to-backend** | Unified view (same SQL) | RUM + APM correlation |
| **Error tracking** | Built-in, linked to replays | Integrated with APM |
| **Pricing** | ~$102/mo (5M events + 50K replays) | Included in Standard MVS |
## Agentic AI and observability intelligence
AI features have moved from differentiator to table stakes in observability. Both platforms shipped meaningful agentic AI capabilities in 2025-2026. The approaches differ in where the AI lives and what it can autonomously do.
### Better Stack: AI SRE and production-ready MCP server
**AI SRE** activates automatically when an incident fires. It analyzes your service map, reviews recent deployments, queries relevant logs, and delivers a root cause hypothesis before you finish reading the alert. At 3am, starting from a hypothesis instead of a blank screen reduces MTTR in a way that is hard to quantify until you have experienced it.
**[Better Stack MCP server](https://betterstack.com/docs/getting-started/integrations/mcp/)** connects Claude, Cursor, or any MCP-compatible AI client directly to your observability data. Your AI assistant can query ClickHouse SQL against your logs, check on-call schedules, acknowledge incidents, and build dashboard queries through natural language:
```json
{
"mcpServers": {
"betterstack": {
"type": "http",
"url": "https://mcp.betterstack.com"
}
}
}
```
The MCP server is generally available to all customers today. You can allowlist specific tools for read-only access or blocklist destructive operations for safety. This is not a beta feature or a preview requiring allowlist approval: it is production-ready for any customer who wants it.
### IBM Instana: agentic AI investigation with GenAI observability

With a single click, Instana launches a full agentic AI investigation into an incident to identify details of the incident, where it occurred, and its impact. Instana then uses agentic AI to create a step-by-step runbook of actions to remediate the incident and can create a Bash script for each step, saving development time.
Instana automatically documents every step of the AI agent's investigation, including the hypotheses tested, evidence collected, components inspected, and the reasoning behind each conclusion, producing a clear, auditable narrative for postmortems, compliance needs, handoffs, and cross-team communication without manually assembling notes or screenshots.
That automatic documentation is a feature Better Stack does not match today. For compliance-sensitive environments where incident records need to be auditable, Instana's agentic investigation trail has clear practical value.
Instana also automatically discovers and maps GenAI workflows and agents, connecting prompts, outputs, tokens, latency, cost, and errors to full-stack context so teams can troubleshoot AI-driven services faster and control spend. If you are running LLM-based applications in production and need to monitor token costs, prompt latency, and model routing alongside traditional APM signals, Instana's GenAI observability is meaningfully mature.
Instana does not have an MCP server as of this writing. The AI capabilities live inside the Instana interface, not in a protocol that external AI clients can access. That means you cannot ask Claude or Cursor to query your Instana data directly. Better Stack's MCP server gives AI assistants direct access to your observability stack in a way Instana does not currently support.
| AI feature | Better Stack | IBM Instana |
|------------|--------------|-------------|
| **Auto investigation** | AI SRE (activates on alert) | Agentic AI (single-click launch) |
| **Remediation scripts** | ✗ | Yes (Bash, Ansible) |
| **Auditable AI reasoning** | ✗ | Yes (full documented trail) |
| **MCP server** | Yes (GA, all customers) | Not available |
| **GenAI / LLM observability** | Basic via OTel | Yes (tokens, prompts, costs, routing) |
| **External AI client access** | Claude, Cursor (via MCP) | Not supported |
## Deployment and integrations
### Better Stack: single collector, open ecosystem
Deploy the eBPF collector via a single Helm chart. It runs as a DaemonSet across your Kubernetes nodes and begins capturing traces and metrics within minutes. No language-specific configuration, no per-service setup.
Better Stack integrations cover 100+ covering all major stacks: MCP, OpenTelemetry, Vector, Prometheus, Kubernetes, Docker, PostgreSQL, MySQL, Redis, MongoDB, Nginx, and more. The [MCP server](https://betterstack.com/docs/getting-started/integrations/mcp/) lets AI clients query observability data directly.
### IBM Instana: mature agent with 300+ technology sensors
Instana provides out-of-the-box integrations with no plug-ins or application restarts, as well as support for third-party technologies and IBM proprietary software and infrastructure.
The Instana agent automatically instruments applications in Java, Node, Python, Go, and .NET. For some languages, an SDK is optionally available. Basic deployment takes hours, and full configuration with dashboards and alerts takes days. Instana integrates with Kubernetes, Docker, and major cloud providers, as well as CI/CD tools to correlate incidents with releases.
The 300+ technology sensor library is genuinely broad. If you are running an uncommon database, a legacy JVM application, or IBM-specific middleware, the probability that Instana already has a sensor for it is high. This is where Instana's longer history as an enterprise APM tool shows up as a practical advantage.
Instana offers shared Slack channels during trial and subscription periods. That is a meaningful support differentiator for teams working through complex deployments. Better Stack also offers dedicated Slack channel support for enterprise customers.
| Deployment aspect | Better Stack | IBM Instana |
|-------------------|--------------|-------------|
| **Time to first trace** | Minutes (eBPF, Helm chart) | Hours to days (agent + sensor config) |
| **Code changes required** | None | None for auto-instrumented technologies |
| **Technology coverage** | 100+ integrations | 300+ technology sensors |
| **IBM ecosystem** | OpenTelemetry only | Native IBM Cloud, IBM Z, IBM middleware |
| **CI/CD correlation** | Via OTel and deployment events | Built-in release detection |
| **Self-hosted** | Optional (S3 bucket) | Full on-prem (at $120/MVS) |
## Status pages
### Better Stack: built-in and automatic
[Better Stack Status Pages](https://betterstack.com/status-pages) is part of the platform. When an incident is declared, the status page updates automatically. No separate tool, no manual cross-posting.
Subscriber notifications go out via email, SMS, Slack, and webhook. Private pages support password protection or SAML SSO. Custom CSS gives full visual control, and multi-language support is included.
**Pricing:** $12-208/month for advanced features, included within Better Stack's incident management.
### IBM Instana: no native status pages
IBM Instana does not include a customer-facing status page product. Teams using Instana for observability typically use a separate tool like Statuspage (Atlassian) or PagerDuty's status page feature for customer communication during incidents. That is another vendor relationship and another monthly line item that does not exist in the Better Stack stack.
| Status pages | Better Stack | IBM Instana |
|--------------|--------------|-------------|
| **Availability** | Built-in, auto-synced with incidents | Not available |
| **Subscriber notifications** | Email, SMS, Slack, webhook | Not available |
| **Custom branding** | Full control + CSS | Not available |
| **Pricing** | Included | Third-party tool required |
## Error tracking
### Better Stack: Sentry-compatible with AI debugging
[Better Stack Error Tracking](https://betterstack.com/error-tracking) accepts Sentry SDK payloads, so teams migrating from Sentry can switch without rewriting their instrumentation. AI-native debugging includes Claude Code and Cursor integration with pre-made prompts that summarize error context directly from the stack trace, letting you paste into your AI coding agent and start debugging without manually reading every frame.

Full trace context shows the distributed trace that led to each error automatically, without configuration.
### IBM Instana: no standalone error tracking product
IBM Instana surfaces errors within its APM trace context, and errors on traces are visible in the trace waterfall view. But Instana does not have a standalone error tracking product with issue grouping, assignment workflows, regression detection, or Sentry SDK compatibility. Teams using Instana for APM typically use Sentry, Bugsnag, or Rollbar separately for application error management.
| Error tracking | Better Stack | IBM Instana |
|----------------|--------------|-------------|
| **Standalone product** | Yes | No (errors visible in APM traces only) |
| **Sentry SDK support** | First-class | Not applicable |
| **AI debugging** | Claude Code + Cursor prompts | Not available |
| **Issue grouping** | Yes | No |
| **Pricing** | $0.000050/exception | N/A |
## Enterprise readiness
Both platforms serve enterprise customers. The differences are in compliance depth, pricing predictability at scale, and ecosystem fit.
Instana holds FedRAMP authorization, which Better Stack does not. For US government agencies or contractors with FedRAMP requirements, that is determinative: Instana is the only viable option between these two platforms. Instana's mainframe support, IBM ecosystem integration, and self-hosted deployment option also give it clear advantages in regulated industries running on-premises or IBM Cloud infrastructure.
Better Stack covers the compliance requirements most non-government enterprises need: SOC 2 Type II, GDPR, SSO via Okta/Azure/Google, SCIM provisioning, RBAC, audit logs, and data residency options. Enterprise customers get a dedicated Slack support channel and a named account manager, the kind of direct access that matters when something is broken and you need someone who knows your environment.
The enterprise pricing dynamic matters at scale. Instana's MVS model grows linearly with your host count at $79.50/host/month. At 500 hosts, that is $39,750/month in MVS licenses alone, before log management, before third-party on-call tooling, before status pages. Better Stack at 500 hosts scales with data volume, not host count. If your 500 hosts generate 10TB of telemetry per month, you are looking at approximately $3,000-4,000/month including incident management and status pages. The gap widens as the fleet grows.
| Enterprise feature | Better Stack | IBM Instana |
|-------------------|--------------|-------------|
| **SOC 2 Type II** | ✓ | ✓ |
| **GDPR** | ✓ | ✓ |
| **FedRAMP** | ✗ | ✓ |
| **HIPAA** | ✗ | ✓ |
| **SSO (SAML/OIDC)** | ✓ (Okta, Azure, Google) | ✓ |
| **SCIM provisioning** | ✓ | ✓ |
| **RBAC** | ✓ | ✓ |
| **Audit logs** | ✓ | ✓ |
| **Data residency** | EU + US regions, optional S3 | US, EU, self-hosted |
| **Self-hosted** | Optional (your S3 bucket) | Yes (on-prem, air-gapped) |
| **Dedicated support channel** | Slack + named account manager | Enterprise support tiers |
| **Mainframe support** | ✗ | IBM Z / z/OS |
| **IBM ecosystem** | OpenTelemetry only | Native IBM Cloud integration |
| **Minimum commitment** | None | 10 MVS licenses |
## Final thoughts
The choice comes down to **enterprise APM depth versus full-stack simplicity**. IBM Instana is a strong fit if you need **FedRAMP compliance, mainframe support, or 100% unsampled tracing**, especially within the **IBM ecosystem**.
For most, **Better Stack is the more practical option**. It combines **logs, metrics, traces, error tracking, incident management, and status pages in one platform**, with **predictable pricing and no per-host licensing**.
While both platforms share similar instrumentation capabilities, the real difference is scope. **Better Stack covers the full incident lifecycle**, while Instana focuses on APM and requires additional tools around it.
If rising costs or operational complexity are concerns, it is worth evaluating a simpler approach.
Learn more: [https://betterstack.com](https://betterstack.com)