# Better Stack vs Hyperping: A Complete Comparison for 2026
Both platforms check the same boxes on paper: uptime monitoring, status pages, on-call scheduling, incident management. **But the similarities fade fast once you look at what each one actually includes, where the pricing lands, and how far the platform stretches when your needs grow beyond a simple health check.**
Hyperping is a sharp, well-executed tool for teams that want reliable external monitoring, polished status pages, and on-call workflows without a lengthy setup. It does those things well, and it doesn't try to do everything else. Better Stack covers that same ground and goes considerably further: **integrated log management, eBPF-based tracing, infrastructure metrics, error tracking, real user monitoring, and an AI SRE that investigates incidents on its own.**
The practical result is that teams evaluating these two platforms are usually answering different questions. One team asks: "do we just need monitoring and a status page?" Another asks: "do we need monitoring plus everything that tells us why something broke?" Both are legitimate questions. **Which one describes your situation will probably determine which platform makes sense.**
This article covers both tools honestly. If Hyperping turns out to be the better fit, the comparison will make that clear.
## Quick comparison at a glance
| Category | Better Stack | Hyperping |
|----------|-------------|-----------|
| **Uptime monitoring** | HTTP, port, keyword, cron, ping | HTTP, port, keyword, cron, ping, TCP, ICMP, DNS |
| **Check interval** | 30 seconds | 20 seconds (Business+) |
| **Monitoring locations** | Global | 18 locations |
| **Browser/E2E checks** | Playwright-based | Playwright-based |
| **Server monitoring** | Agent-based (CPU, memory, disk, network) | Agent-based (CPU, memory, disk, network) |
| **Log management** | Yes (SQL-queryable, 100% indexed) | No |
| **Distributed tracing/APM** | Yes (eBPF-based, zero code) | No |
| **Error tracking** | Yes | No |
| **Real user monitoring** | Yes | No |
| **Status pages** | Yes | Yes |
| **Incident management** | Yes (on-call, escalation, Slack-native) | Yes (on-call, escalation, multi-channel) |
| **AI SRE** | Yes (autonomous incident investigation) | No |
| **MCP server** | Yes (GA) | Yes (GA, 26 tools) |
| **Pricing model** | Data volume + responders + monitors | Flat monthly tiers |
| **EU hosting** | EU + US regions available | EU-first (French company) |
| **GDPR** | Yes | Yes (by design) |
| **SSO/SAML** | Yes | Business plan+ |
| **Audit logs** | Yes | Business plan+ |
## Platform scope
Hyperping and Better Stack make a different bet about what a monitoring platform should be. Hyperping bets that most teams want one sharp tool that handles uptime, status, and on-call, without bundling in capabilities they'll never use. Better Stack bets that monitoring only tells you *that* something is wrong, and you also need logs, traces, and error context to understand *why*.
Neither bet is wrong. The question is which one matches how your team actually works.
Hyperping's product surface is: uptime monitoring (HTTP, API, DNS, SSL, port, ping, cron jobs), Playwright-based browser checks, server metrics, status pages, and on-call with escalation. That's a complete toolkit for external monitoring and outage communication. What's absent by design: no log management, no APM, no error tracking, no RUM. If you already use Datadog, Sentry, or another observability platform for those things, Hyperping can sit alongside them as your external monitoring layer.
Better Stack's scope is broader. The same platform handles uptime monitoring, on-call and incident management, status pages, centralized log management with ClickHouse SQL querying, eBPF-based distributed tracing, infrastructure metrics, error tracking, and real user monitoring. The advantage is that when a monitor fires, every relevant signal sits in the same interface. You don't need to switch to a different tool to find the log lines that explain the outage.
Does your team currently open three or four different tabs when an alert fires? If so, the platform scope question matters more than it might seem.
### Architecture comparison
| Aspect | Better Stack | Hyperping |
|--------|-------------|-----------|
| **Primary focus** | Full-stack observability | Uptime monitoring + status pages |
| **Data collection** | eBPF collector + agents + OpenTelemetry | Lightweight server agent + external probes |
| **Storage** | Unified data warehouse (logs, metrics, traces) | Monitoring metrics and check history |
| **Query layer** | SQL + PromQL across all telemetry | Dashboard-based, no raw query language |
| **Incident context** | Logs, traces, metrics in one view | Uptime and check data only |
| **AI capabilities** | AI SRE (autonomous investigation) | None |
| **MCP server** | GA, covers all platform data | GA, 26 tools covering monitoring data |
## Uptime monitoring
This is the category where Hyperping competes most directly with Better Stack, and it's genuinely strong. Multi-location verification, 30-second check intervals on paid plans (20 seconds on Business), false-positive protection via double-check logic, and SSL/DNS monitoring all come included.
### Hyperping: precise and reliable external monitoring

Hyperping runs checks from 18 global locations across North America, Europe, and Asia. Every monitor type available includes HTTP/HTTPS, TCP port, ICMP ping, DNS, SSL certificate expiry, keyword matching, and cron job heartbeats. The platform's standout design choice is multi-location verification: before triggering an alert, it confirms the failure from multiple regions to eliminate false alarms. Users on G2 consistently cite this as the reason they trust Hyperping's alerts more than some alternatives.
Browser checks use Playwright, allowing teams to script and monitor complete user flows (login, checkout, signup) rather than just endpoint availability. On the Business plan, you get 25 browser checks; on Pro, 10. These run every 5 minutes by default.
Server monitoring is handled via a lightweight agent that collects CPU, memory, disk, and network metrics. Metric history varies by plan (7 days on Essentials, up to 30 days on Business), and the data sits alongside uptime history in the Hyperping dashboard.
What Hyperping does not do: there's no correlation between a failed HTTP check and the log output from the server that handled the request. When a monitor goes red, your investigation starts in Hyperping and continues in whatever logging or APM tool you use separately.
### Better Stack: uptime monitoring inside full-stack observability
[Better Stack uptime monitoring](https://betterstack.com/monitoring) covers the same external check types: HTTP, TCP, ping, DNS, keyword, cron/heartbeat monitoring from multiple global regions. Checks run every 30 seconds, multi-location verification prevents false positives, and SSL certificate monitoring is included.
The meaningful difference is what happens after the alert. When a Better Stack monitor triggers, the incident view immediately surfaces correlated log entries, infrastructure metrics, and traces from the affected service, all without leaving the platform. You're not starting an investigation from scratch.
Browser checks use Playwright for scripted E2E tests. The [MCP server](https://betterstack.com/docs/getting-started/integrations/mcp/) means AI assistants like Claude or Cursor can query monitor status, check who's on-call, and acknowledge incidents through natural language without switching interfaces. Integrations cover 100+ major stacks: OpenTelemetry, Vector, Prometheus, Kubernetes, Docker, PostgreSQL, MySQL, Redis, MongoDB, Nginx, and more.
| Uptime monitoring | Better Stack | Hyperping |
|-------------------|-------------|-----------|
| **Check types** | HTTP, TCP, ping, DNS, SSL, keyword, cron | HTTP, TCP, ping, DNS, SSL, keyword, cron |
| **Check interval** | 30 seconds | 20 seconds (Business+), 30 sec (Pro) |
| **Monitoring locations** | Global | 18 locations |
| **Multi-location verification** | Yes | Yes |
| **Browser/E2E checks** | Playwright | Playwright |
| **SSL monitoring** | Yes | Yes |
| **Post-alert context** | Logs, traces, metrics in same view | Check history only |
| **MCP integration** | Yes (GA) | Yes (GA) |
| **Server metrics** | Agent-based | Agent-based |
## Pricing comparison
The pricing structures are fundamentally different, and the comparison depends heavily on what you're buying.
Hyperping uses flat monthly tiers. You know your bill before the month starts because it's determined by your plan, not by data volume. Better Stack uses a consumption model: you pay for GB of logs ingested and stored, number of responders, and number of monitors. That model scales in proportion to usage, which means costs grow predictably with actual workload rather than jumping between plan tiers.
### Hyperping: flat-tier pricing
Hyperping's plans are transparent and easily understood.
**Pricing tiers:**
- Free: $0/month (20 monitors, 5-minute interval, 1 status page, 1 seat)
- Essentials: $24/month billed annually (50 monitors, 30-second interval, 5 server agents, 3 browser checks, 1 status page, on-call and escalation, all integrations)
- Pro: $74/month billed annually (100 monitors, 20 server agents, 10 browser checks, 3 status pages, phone alerts, 5 seats)
- Business: $249/month billed annually (1,000 monitors, 100 server agents, 25 browser checks, 10 status pages, SAML SSO, audit logs, white labeling, priority support, 15 seats included, then $12/seat)
- Enterprise: custom pricing (custom monitor counts, dedicated support, white-glove migration)
**20 monitors at 30-second intervals example:** Pro at $74/month covers 100 monitors. No per-monitor charge, no per-check-execution fee.
The SMS credit system on lower tiers is worth noting: Essentials includes 20 SMS credits, Pro includes 75. Heavy SMS alert volume may require upgrades. Phone call alerts start at Pro.
### Better Stack: consumption-based pricing
Better Stack charges for what you actually use across the full platform.
**Pricing structure:**
- Logs: $0.10/GB ingestion + $0.05/GB/month retention (all searchable, no indexing fees)
- Traces: $0.10/GB ingestion + $0.05/GB/month retention
- Metrics: $0.50/GB/month
- Monitors: $0.21/month each (or $21/month per 50 monitors)
- Responders: $29/month each (unlimited phone/SMS)
- Error tracking: $0.000050 per exception
- Status pages: $12-208/month for advanced features
**Uptime monitoring only, 100 monitors + 5 responders:** $21 + $145 = $166/month. That's monitors plus responders, nothing else.
**Full platform, 100 monitors + logging + 5 responders:** Costs scale with actual data volume. A team producing 250GB/month of logs would add $25 ingestion + $12.50 retention = $37.50/month for logs on top of the monitoring base.
The consumption model rewards teams that instrument carefully and penalizes unlimited ingestion without discipline. If you're coming from a tool like Datadog where log indexing costs created painful surprises, Better Stack's model (all logs searchable at flat per-GB rates, no indexing tier) is a meaningful improvement. If you want a completely predictable flat bill regardless of usage, Hyperping's tier model delivers that.
### 3-year TCO comparison
For a team needing monitoring, on-call, and status pages (Hyperping's core scope) with 5 responders and 100 monitors:
| Category | Better Stack | Hyperping Business |
|----------|-------------|-------------------|
| Monitoring (100 monitors) | $756/year | Included in plan |
| On-call (5 responders) | $1,740/year | Included in plan |
| Status pages | $144-2,496/year | Included in plan |
| Platform base | $0 | $2,988/year |
| **3-year total (monitoring only)** | **~$7,740** | **~$8,964** |
Both platforms are in a similar range for monitoring-only scenarios. The comparison shifts substantially when Better Stack's additional capabilities (logs, APM, error tracking) eliminate separate tools.
If you're currently paying for uptime monitoring, a logging platform, and an error tracking tool separately, consolidating on Better Stack changes the math considerably. Hyperping doesn't replace those tools; it sits alongside them.
## E2E browser monitoring
Synthetic browser testing verifies that real user flows work, not just that an endpoint responds. Both platforms use Playwright for this.
### Hyperping: Playwright browser checks built in

Hyperping's browser checks run Playwright scripts (and legacy Puppeteer support) against your application on a configurable schedule. You write the script, Hyperping executes it from its monitoring network and alerts you when steps fail. This is useful for checkout flows, login flows, form submissions, and any multi-step user journey where endpoint availability doesn't tell the full story.
The check runs every 5 minutes by default. Plan limits determine how many browser checks you can configure: 3 on Essentials, 10 on Pro, 25 on Business. Results appear in the Hyperping dashboard alongside uptime history; there's no separate product to navigate.
One area where the integration is limited: when a browser check fails, the investigation starts and ends in Hyperping. You see the failure, the step that failed, and the error message. The correlated server-side log output requires a separate tool.
### Better Stack: E2E checks with correlated observability
Better Stack's Playwright-based browser checks work similarly: write scripts, configure schedules, receive alerts on failures. The difference in practice is what's available when a check fails. Since logs, server metrics, and traces are in the same platform, clicking through from a failed browser check to the backend behavior during that test requires no tool-switching.
**OpenTelemetry-native tracing** captures what your backend did during a browser check without requiring any changes to how you've written the Playwright scripts. The eBPF collector instruments the backend automatically.
| Browser/E2E monitoring | Better Stack | Hyperping |
|------------------------|-------------|-----------|
| **Technology** | Playwright | Playwright |
| **Failed check context** | Logs + traces + metrics in same view | Error message and step data only |
| **Check frequency** | Configurable | 5-minute default |
| **Plan limits** | Scales with usage | 3/10/25 depending on plan |
| **Backend correlation** | Automatic (eBPF) | Requires separate tool |
## Incident management and on-call
Both platforms include on-call scheduling, escalation policies, and multi-channel alerting. This is one of Hyperping's strongest areas and compares more directly with Better Stack than most other categories.
### Hyperping: solid on-call with all the essentials

Hyperping includes on-call scheduling, escalation policies, and multi-channel alerts starting from the Essentials plan. Phone call alerts require Pro or above. You can configure rotation schedules, time-based escalation rules, and integrate with PagerDuty or OpsGenie for teams already using those tools.
Incident management is handled through the dashboard: create incidents manually, attach them to status pages, add updates, and notify subscribers. There's no native Slack-based incident channel creation (unlike Better Stack), but Slack alerts and webhook notifications are available.
The escalation policies support multiple tiers with configurable delay times between steps. If the first responder doesn't acknowledge, the incident escalates to the next person or group. This is standard on-call functionality done cleanly.
What Hyperping doesn't include: AI-powered post-mortems, automatic incident timeline generation from observability data, or Slack-native incident channels with built-in investigation tools.
### Better Stack: incident management with full context
[Better Stack incident management](https://betterstack.com/incident-management) includes unlimited phone and SMS alerts at $29/month per responder, on-call scheduling with timezone-aware rotations, multi-tier escalation policies, and Slack-native incident management with dedicated channels and investigation tools built in.
The post-mortem tooling is where the platform diverges from Hyperping. Better Stack generates post-mortems automatically from incident timelines, populating them with the sequence of events, who acknowledged when, what changed, and related log and metric context. Hyperping's incident management produces a useful incident record but doesn't connect to backend observability data.
For enterprise teams needing complex escalation logic, Better Stack supports multi-tier policies with time-based rules, metadata filters, and advanced routing.
| Incident management | Better Stack | Hyperping |
|--------------------|-------------|-----------|
| **Phone/SMS alerts** | Unlimited ($29/responder/month) | SMS credits per plan; phone on Pro+ |
| **On-call scheduling** | Yes | Yes |
| **Escalation policies** | Multi-tier, metadata filters | Multi-tier |
| **Slack-native incidents** | Yes (dedicated channels + investigation tools) | Alert only |
| **PagerDuty/OpsGenie integration** | Yes | Yes |
| **Post-mortems** | Automated from timeline + observability data | Manual |
| **Incident timeline** | Automatic (includes log/metric context) | Incident history only |
## Status pages
Status pages are table stakes for both platforms. The comparison here is about feature depth and multi-channel subscriber notifications.
### Hyperping: polished status pages with white-labeling

Hyperping's status pages are among the best-looking in the market, and that reputation shows up consistently in user reviews. Custom domains, branded design, embedded real-time metrics, scheduled maintenance announcements, and multi-language support all work on every paid plan.
The Business plan adds white-labeling (removing Hyperping branding), custom email domains for subscriber notifications, SAML SSO for private pages (via Okta or Microsoft), and IP allowlisting. Private status pages are available with email access codes or Google Analytics integration. Subscribers receive email notifications; Slack subscriber notifications are not available (Slack alerting for the team is available, but not for external subscribers).

### Better Stack: status pages with multi-channel subscriber alerts
[Better Stack Status Pages](https://betterstack.com/status-pages) connects directly to the incident management layer: when an incident is declared, the status page updates automatically. Subscribers can receive notifications via email, SMS, Slack, or webhook.
Custom domains, full CSS control, private pages (password-protected or SSO), and multi-language support are included. The main advantage over Hyperping in this category: subscriber notifications go beyond email. Teams whose customers prefer Slack or webhook integrations for status updates can offer that.
| Status pages | Better Stack | Hyperping |
|--------------|-------------|-----------|
| **Custom domains** | Yes | Yes |
| **White labeling** | Yes | Business plan |
| **Private pages (SSO)** | Yes | Business plan (SAML) |
| **Subscriber notifications** | Email, SMS, Slack, webhook | Email only |
| **Incident auto-sync** | Yes | Yes |
| **Multi-language** | Yes | Yes |
| **Embedded metrics** | Yes | Yes |
| **Custom CSS** | Yes | Yes |
## Log management
This is a category where Hyperping makes no attempt to compete. If log management is a requirement, it's a separate purchase alongside Hyperping or a reason to evaluate Better Stack instead.
### Hyperping: no log management
Hyperping doesn't offer log ingestion, log search, or log-based alerting. This is a deliberate scope decision, not a gap in development. Teams using Hyperping handle logs separately via Datadog, Better Stack Logs, Papertrail, Logtail, or another logging platform.
If your team already has a logging solution and is evaluating monitoring platforms independently, this isn't a blocker. If you're looking to consolidate observability tooling, it matters.
### Better Stack: SQL-queryable log management with no indexing fees
[Better Stack Logs](https://betterstack.com/logs) ingests logs at $0.10/GB and stores them at $0.05/GB/month. Every ingested log is immediately searchable via SQL or PromQL, with no indexing tier required.
The Live Tail view provides real-time log streaming with filtering. SQL queries let you aggregate and analyze structured log data across time ranges, services, and fields.
```sql
SELECT
service_name,
COUNT(*) as error_count,
AVG(duration_ms) as avg_duration
FROM logs
WHERE level = 'error'
AND timestamp > NOW() - INTERVAL '1 hour'
GROUP BY service_name
ORDER BY error_count DESC
```
Logs correlate with uptime monitor alerts automatically: when a monitor fires, the incident view shows related log lines from the affected service in the same screen.
| Log management | Better Stack | Hyperping |
|----------------|-------------|-----------|
| **Log ingestion** | Yes ($0.10/GB) | No |
| **100% searchable** | Yes (no indexing tier) | N/A |
| **Query language** | SQL + PromQL | N/A |
| **Alert-to-log correlation** | Automatic | Requires separate tool |
| **Live tail** | Yes | No |
## Application performance monitoring and tracing
Hyperping doesn't offer APM or distributed tracing. This section covers Better Stack's APM capability and how it changes the incident investigation experience.
### Hyperping: no APM
External uptime checks and server resource metrics are Hyperping's ceiling for application visibility. There's no distributed tracing, no service maps, no database query monitoring, and no code-level profiling. This is consistent with Hyperping's positioning as an uptime monitoring platform rather than an observability platform.
For teams that need APM, Hyperping is typically deployed alongside a dedicated APM tool. The two don't share data; investigation happens in parallel across tools.
### Better Stack: eBPF-based APM with zero instrumentation
[Better Stack's APM](https://betterstack.com/tracing) uses eBPF to capture distributed traces at the kernel level, requiring no changes to application code. Deploy the collector to Kubernetes via Helm chart and HTTP/gRPC traffic between services is captured automatically. Database queries to PostgreSQL, MySQL, Redis, and MongoDB are traced without per-database configuration.
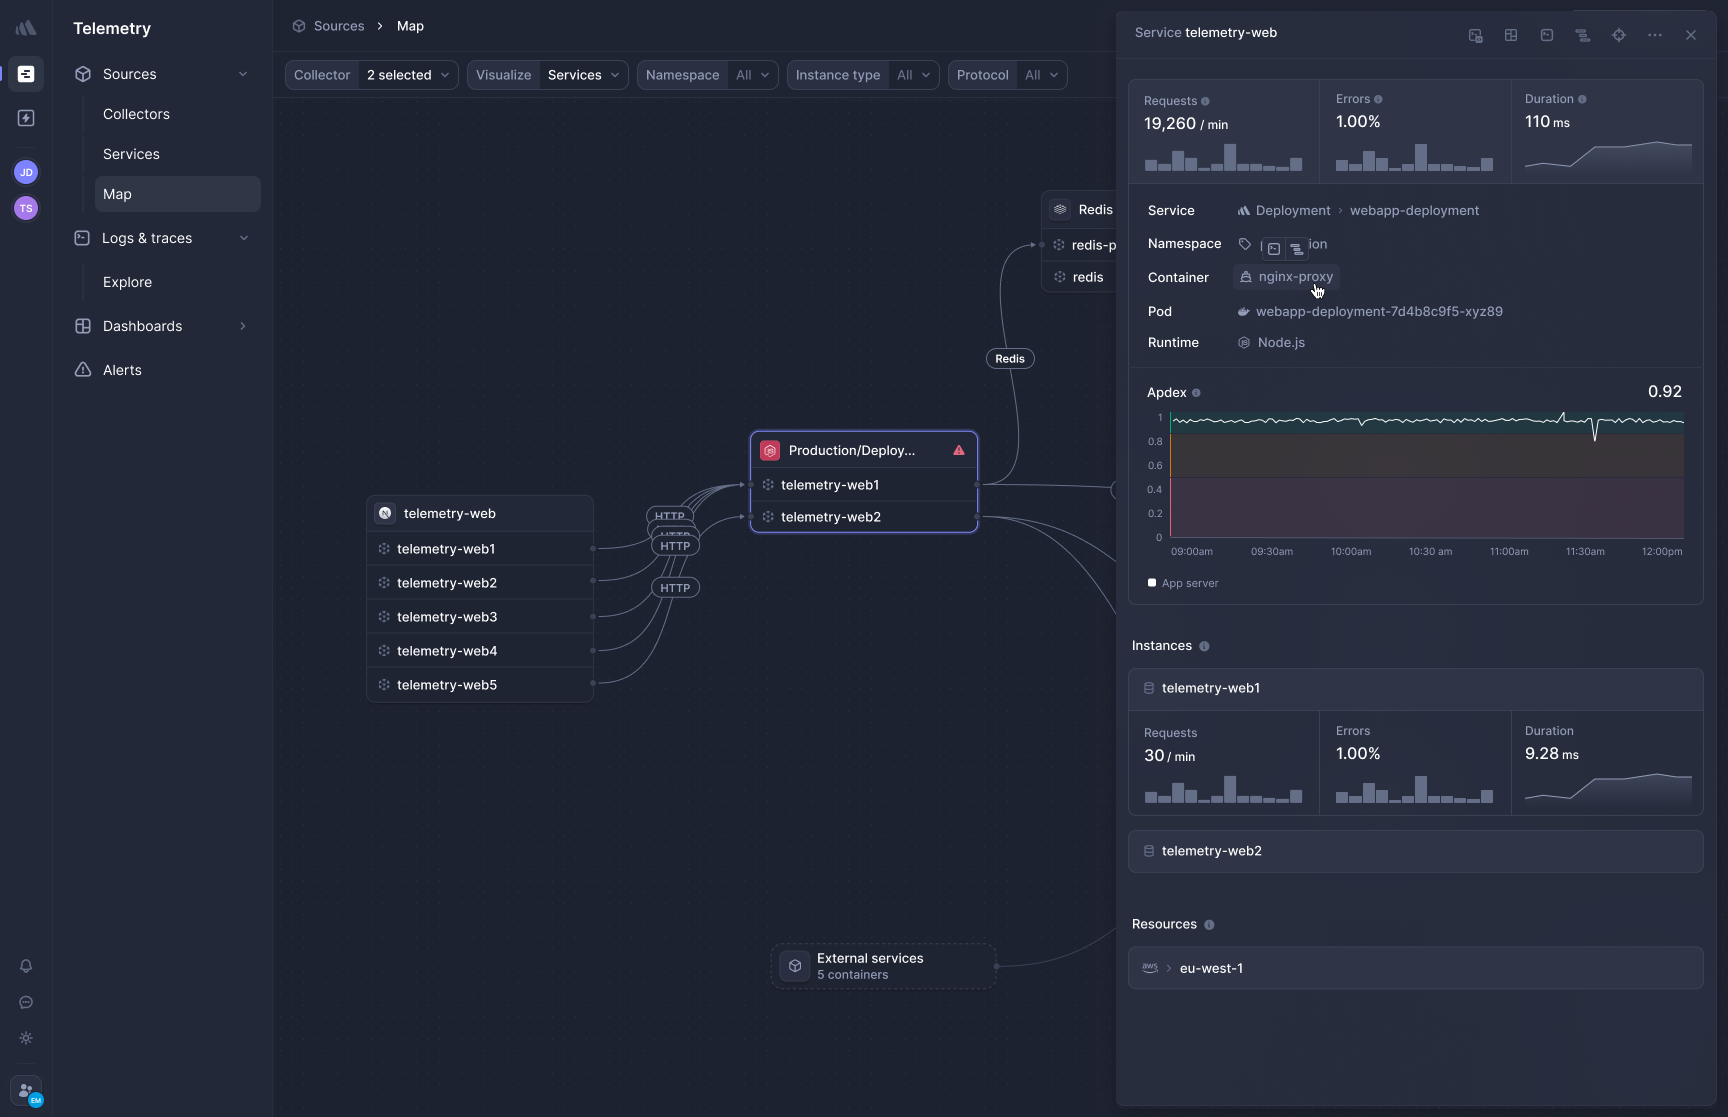
**Frontend-to-backend correlation** connects browser session data with backend trace data in a single view. When real user monitoring shows a slow page load, you can trace it from the frontend request through every microservice and database call without switching products.
**OpenTelemetry-native, zero lock-in.** Traces use the OTel format natively, which means the data is yours and the instrumentation isn't tied to Better Stack's proprietary agents. Moving elsewhere means a configuration change, not a re-instrumentation project. How much would it cost your team to migrate away from a proprietary APM agent today?
| APM/Tracing | Better Stack | Hyperping |
|-------------|-------------|-----------|
| **Distributed tracing** | Yes (eBPF, zero code) | No |
| **Database tracing** | Automatic | No |
| **Frontend-to-backend** | Yes | No |
| **Service maps** | Yes | No |
| **OpenTelemetry** | Native | N/A |
| **Code-level profiling** | Network-level | No |
## Infrastructure metrics
Server resource monitoring is an area both platforms cover, though with different depth and integration context.
### Hyperping: agent-based server metrics
Hyperping's server monitoring agent collects CPU usage, memory, disk, and network metrics from any server where it's deployed. Metric history is retained for 7 days on Essentials, 14 on Pro, and 30 days on Business. Alert thresholds can be configured per metric.
The metrics sit in the Hyperping dashboard alongside uptime check history, which gives a combined view of "is the site up" and "what are server resources doing." This is useful for spotting resource pressure before it causes downtime.
What's absent: there's no PromQL support, no custom metric ingestion, and no cardinality handling. The server metrics are a monitoring layer, not a full metrics platform.
### Better Stack: metrics with PromQL and no cardinality penalties
[Better Stack metrics](https://betterstack.com/infrastructure-monitoring) charges based on data volume rather than per unique metric combination. Add high-cardinality tags freely without cost anxiety.
Full PromQL support means Prometheus users can migrate without relearning a query language. Custom metric ingestion accepts data from OpenTelemetry collectors, Prometheus exporters, and any compatible source.
| Metrics | Better Stack | Hyperping |
|---------|-------------|-----------|
| **Server resource metrics** | Yes (agent-based) | Yes (agent-based) |
| **Custom metrics** | Yes (OTel, Prometheus) | No |
| **PromQL support** | Yes | No |
| **Metric history** | Configurable retention | 7-30 days (plan-dependent) |
| **Cardinality** | No penalty (volume-based) | N/A |
| **Alert-to-metric correlation** | Automatic (same platform) | Dashboard only |
## AI and MCP
Both platforms have shipped MCP servers, which is a meaningful differentiator from most monitoring tools. The AI capabilities diverge more significantly.
### Hyperping: MCP server with 26 tools
Hyperping launched an MCP server that connects Claude, Cursor, Windsurf, and other MCP-compatible clients to your Hyperping project. With 26 tools covering read and write operations, you can query monitor status, drill into outage history, follow the on-call chain, and pause services from a prompt. Keys are project-scoped, and destructive operations (deletion) are intentionally excluded.
```json
{
"mcpServers": {
"hyperping": {
"type": "http",
"url": "https://mcp.hyperping.com",
"headers": { "Authorization": "Bearer YOUR_API_KEY" }
}
}
}
```
The MCP scope is limited to Hyperping's data: uptime monitors, incidents, on-call, and status pages. There's no AI investigation beyond what the AI client does with the data it retrieves.
### Better Stack: AI SRE plus MCP across full observability data
Better Stack's AI SRE activates autonomously when an incident fires. It doesn't wait to be prompted: it analyzes your service map, queries recent log patterns, checks deployment history, and delivers a hypothesis about root cause before your on-call engineer has opened their laptop. At 3am, that distinction matters.
The [Better Stack MCP server](https://betterstack.com/docs/getting-started/integrations/mcp/) is generally available to all customers. Because Better Stack's platform covers logs, metrics, traces, error tracking, and monitoring, the MCP surface is correspondingly broader: your AI assistant can query log data with ClickHouse SQL, check monitor status, acknowledge incidents, build dashboard charts, and inspect on-call schedules, all from a single configured connection.
```json
{
"mcpServers": {
"betterstack": {
"type": "http",
"url": "https://mcp.betterstack.com"
}
}
}
```
Both platforms support read-write MCP operations with access scoping. Better Stack's scope covers a much larger surface area because the platform itself covers more.
| AI and MCP | Better Stack | Hyperping |
|-----------|-------------|-----------|
| **MCP server** | Yes (GA) | Yes (GA) |
| **MCP tools count** | Full platform coverage | 26 tools |
| **MCP data scope** | Logs, traces, metrics, monitoring, incidents | Monitoring, incidents, on-call |
| **AI SRE** | Yes (autonomous, activates on incident) | No |
| **AI-powered post-mortems** | Yes | No |
| **Autonomous root-cause investigation** | Yes | No |
## Deployment and integrations
How quickly can you go from "we need monitoring" to "we have monitoring"? Both platforms are fast, but they're fast in different ways.
### Hyperping: minutes to first alert
Hyperping's onboarding is genuinely quick. Add your first monitor, choose your alert channels, and you're receiving alerts within minutes. There's no agent to deploy for uptime monitoring; external probes handle all HTTP, port, DNS, and SSL checks. Server monitoring requires installing a lightweight agent, but the installation is straightforward.
Integrations for alerting cover Slack, Microsoft Teams, PagerDuty, OpsGenie, Discord, Telegram, SMS, email, and webhooks. The Business plan also supports custom email domains for alerts and subscriber notifications. For teams already in PagerDuty or OpsGenie, Hyperping can push alerts into existing workflows without disrupting on-call tooling.
Third-party open-source tooling from Develeap brings Hyperping into infrastructure-as-code, Python, and observability workflows, though this is a community contribution rather than a first-party integration library.
What Hyperping doesn't integrate with: OpenTelemetry, Prometheus, Vector, or any log pipeline tooling. The integration surface is alert delivery, not data collection.
### Better Stack: collector-first with open standards
Better Stack deploys via a Helm chart for Kubernetes (one DaemonSet per cluster, automatic service discovery) or via standalone agent for VMs and containers. Once deployed, the collector starts capturing metrics and traces without additional configuration. Log ingestion accepts data from any source: the eBPF collector, Vector pipelines, OpenTelemetry collectors, Fluentd, Logstash, or direct HTTP ingestion.
Integrations cover 100+ major stacks: MCP, OpenTelemetry, Vector, Prometheus, Kubernetes, Docker, PostgreSQL, MySQL, Redis, MongoDB, Nginx, and more. The MCP server adds AI assistant integration that most monitoring platforms haven't shipped yet.
| Deployment and integrations | Better Stack | Hyperping |
|-----------------------------|-------------|-----------|
| **Time to first alert** | Minutes (uptime monitoring) | Minutes |
| **Agent required** | Optional (eBPF collector for APM/metrics) | Required for server metrics |
| **OpenTelemetry** | Native (first-class) | Not applicable |
| **Prometheus** | Yes (PromQL support) | Not applicable |
| **Vector** | Yes | Not applicable |
| **Alert channels** | Slack, Teams, phone, SMS, email, webhook, PagerDuty, OpsGenie | Slack, Teams, phone, SMS, email, webhook, PagerDuty, OpsGenie, Discord, Telegram |
| **Infrastructure-as-code** | Terraform provider, Helm chart | Community tools |
## Error tracking and RUM
Hyperping doesn't offer error tracking or real user monitoring. These capabilities are part of Better Stack's platform.
### Hyperping: no error tracking or RUM
If JavaScript error tracking, backend exception grouping, or session replay are requirements, Hyperping isn't the tool. Teams using Hyperping for uptime monitoring handle errors via Sentry, Bugsnag, or similar tools. RUM is handled separately via a dedicated analytics platform.
This is a meaningful scope gap for teams evaluating a platform that covers the full frontend-to-backend reliability picture.
### Better Stack: error tracking and RUM built in
[Better Stack Error Tracking](https://betterstack.com/error-tracking) accepts Sentry SDK payloads, which means teams can migrate without changing their instrumentation. AI-powered debugging integrations with Claude Code and Cursor provide pre-built prompts that summarize error context directly in your development tool.
**Real user monitoring** captures frontend sessions, Core Web Vitals (LCP, CLS, INP), JavaScript errors, and user behavior analytics. Session replay allows reviewing user sessions with filters for rage clicks, dead clicks, and errors. Because RUM sits in the same platform as backend traces, a slow page load in a session replay links directly to the backend trace that caused it.

**Website analytics** tracks referrers, UTM campaigns, entry/exit pages, and real-time traffic sources. Pricing for RUM is volume-based at $0.00150/session replay, included in the same billing model as logs and metrics.
| Error tracking and RUM | Better Stack | Hyperping |
|------------------------|-------------|-----------|
| **Error tracking** | Yes (Sentry-compatible) | No |
| **Session replay** | Yes | No |
| **Core Web Vitals** | Yes (LCP, CLS, INP) | No |
| **Frontend-to-backend correlation** | Yes (same platform) | No |
| **Website analytics** | Yes | No |
| **AI debugging integration** | Claude Code + Cursor | No |
## Enterprise readiness
### Hyperping: strong enterprise fundamentals, EU-native
Hyperping's enterprise story is built around a few genuine strengths: GDPR compliance that's native rather than retrofitted (the company is French, data is stored in EU data centers), flat-rate pricing that doesn't create per-seat surprises as teams grow, and a clean SAML SSO and audit log story from the Business plan upward.
SAML SSO supports Okta, Azure AD, Google Workspace, and any compatible IdP. Audit logs cover account changes and actions. White-labeling on Business allows agencies and enterprise teams to remove Hyperping branding. IP allowlisting and private status pages with SAML protection are included on Business.
What Hyperping doesn't have: SOC 2 Type II certification (GDPR compliance is documented, SOC 2 is not listed on the security page), SCIM provisioning, or RBAC beyond team-level access controls. Enterprise SLAs are available on the Enterprise plan (custom). The security page documents GDPR compliance, DPA availability, data subject rights handling, and vulnerability disclosure, but doesn't list third-party compliance certifications beyond GDPR.
### Better Stack: SOC 2 Type II with standard enterprise controls
Better Stack holds SOC 2 Type II certification and is GDPR compliant, with data stored in DIN ISO/IEC 27001-certified data centers. Enterprise features include SSO via Okta, Azure, and Google; SCIM provisioning; RBAC; audit logs; data residency (EU and US regions, with optional self-hosted S3 bucket); and a dedicated Slack support channel plus named account manager at enterprise tier.
Is your procurement team asking for SOC 2 Type II reports? Better Stack can provide them. Does your team care more about EU data sovereignty and GDPR compliance? Both platforms cover that requirement, with Hyperping having the structural advantage of being a French company with primary EU data storage.
| Enterprise feature | Better Stack | Hyperping |
|-------------------|-------------|-----------|
| **SOC 2 Type II** | Yes | Not listed |
| **GDPR** | Yes | Yes (native, EU company) |
| **HIPAA** | No | No |
| **SSO/SAML** | Yes | Business plan+ |
| **SCIM provisioning** | Yes | No |
| **RBAC** | Yes | Basic (team-level) |
| **Audit logs** | Yes | Business plan+ |
| **Data residency** | EU + US, optional S3 | EU-first |
| **White labeling** | Yes | Business plan+ |
| **Dedicated support channel** | Slack + account manager | Priority support (Business+) |
| **Enterprise SLA** | Yes | Custom (Enterprise plan) |
## User experience and interface
Both platforms have a reputation for clean UIs, which is unusual in monitoring tooling. The difference is in navigation depth.
### Hyperping: simple, fast, and focused
Hyperping's interface is purpose-built for what it does. The dashboard shows all monitors at a glance with current status and last-checked timestamps. Click a monitor for detailed history, response time charts, and SSL/DNS status. The status page editor is live, with changes reflected in near-real-time. Setting up on-call schedules and escalation policies takes minutes rather than hours.
G2 reviewers consistently describe Hyperping as having "probably the best looking interface you'll ever get to work with" for a monitoring tool. The onboarding path requires no technical expertise, and the absence of observability complexity means you're never faced with a concept (cardinality, sampling rates, trace retention) that takes time to learn.
The tradeoff is depth. There's no query language to learn because there's nothing to query beyond monitor history. If you want to slice monitoring data by custom dimensions, build complex dashboard expressions, or correlate uptime check results with application telemetry, the interface can't do that.
### Better Stack: unified interface across a broader surface
Better Stack's interface follows a similar design principle: clean, modern, and low-friction to start. The Live Tail log view, the alert management screen, and the on-call schedule builder all share the same visual language. Where the complexity increases is in the query layer: SQL and PromQL require some familiarity to use effectively, though they're standard languages your team likely already knows.
The investigation workflow benefits from the unified interface. When an alert fires, all context (service map, log lines from the affected service, metric anomalies, recent traces) appears in one view without navigating to a different product. Is your team currently describing incident response time as "30 minutes to find the relevant logs"? That's the problem a unified interface solves.
| User experience | Better Stack | Hyperping |
|----------------|-------------|-----------|
| **Onboarding time** | Minutes for monitoring, hours for full platform | Under 5 minutes |
| **Interface complexity** | Moderate (SQL/PromQL for queries) | Low (no query language) |
| **Dark mode** | Yes | Yes |
| **Investigation clicks** | 2-3 (all context in one view) | 2-3 (monitoring context only) |
| **Learning curve** | Low for monitoring, moderate for observability features | Very low |
| **Mobile app** | No | No |
## Final thoughts
This comparison isn't really about which platform is better. **It's about which problem you're actually trying to solve.**
Hyperping is one of the cleanest uptime monitoring tools available. The status pages are polished, the pricing is predictable, and being a French company with EU-first data storage is a genuine advantage for European teams with GDPR obligations. **If external monitoring, status communication, and on-call scheduling cover your full requirements, Hyperping delivers without overcomplicating anything.**
**Better Stack** covers that same scope and extends into the observability layer: **logs, traces, metrics, error tracking, real user monitoring, and an AI SRE that investigates incidents without waiting to be asked**. It's the stronger fit for teams where monitoring catches the problem but observability data explains it, and where consolidating multiple tools into one platform reduces the context-switching that makes incidents take longer than they should.
Ready to see what Better Stack looks like across your full stack? [Start your free trial](https://betterstack.com) or check the [pricing calculator](https://betterstack.com/pricing) to see what consolidating your current tooling would actually cost.