# Better Stack vs Axiom: A Complete Comparison for 2026
Axiom built something genuinely strong: a **fast, cost-efficient event data platform** with excellent compression, a query language teams actually enjoy using, and tight integration with modern developer workflows. Its **APL language, production-ready MCP server, and MetricsDB architecture** make it particularly effective for handling high-cardinality data without runaway costs.
So why does Better Stack come out ahead?
Because the difference is not in how well data is stored or queried. It is in **what happens after the data tells you something is wrong**.
Axiom is a **data platform**. It excels at ingesting, querying, and analyzing logs, traces, and metrics. But when an alert fires, you still need to rely on other tools to **page the right person, coordinate the response, and communicate with users**.
Better Stack is built around that entire workflow. It connects **observability, on-call scheduling, incident management, and status pages in one system**, so the path from detection to resolution stays in one place instead of jumping across tools.
That difference becomes obvious during incidents. **Axiom helps you understand what happened. Better Stack helps you handle what happens next.**
This comparison breaks down both platforms honestly. Axiom leads in several areas, especially as a data platform. **Better Stack covers more of the operational surface, including the parts teams rely on when things break.**
## Quick comparison at a glance
| Category | Better Stack | Axiom |
|---|---|---|
| **Deployment** | eBPF auto-instrumentation, zero code changes | OTel SDK + API; requires instrumentation |
| **Logs** | ClickHouse-powered, SQL queryable, 100% indexed | EventDB with APL; 95%+ compression, no sampling |
| **Traces (distributed)** | eBPF-based, automatic service discovery | Full OTel trace support, waterfall views |
| **Metrics** | Prometheus-compatible, PromQL, no cardinality penalties | MetricsDB GA, hyper-cardinality by design |
| **AI engineering** | AI SRE + MCP (GA) | MCP server (GA), AI-generated dashboards, Spotlight |
| **Incident management** | Built-in: phone/SMS, on-call, escalation, post-mortems | Not included |
| **Status pages** | Built-in, multi-channel subscriber notifications | Not included |
| **Error tracking** | Built-in, Sentry-compatible | Not included |
| **RUM** | Available now | Not included |
| **Pricing model** | Volume + responders | Compute credits + storage |
| **Free plan** | 3 GB logs/traces/metrics, 10 monitors, incident management | 500 GB data loading, 25 GB storage |
| **Enterprise** | SOC 2 Type II, GDPR, SSO, SCIM, RBAC, audit logs | SOC 2 Type II, GDPR, HIPAA (with NDA) |
## Platform architecture
Every observability comparison eventually comes down to an architectural question: is this a data platform, or an operational platform? The answer shapes what happens when something goes wrong.
### Better Stack: unified operational platform

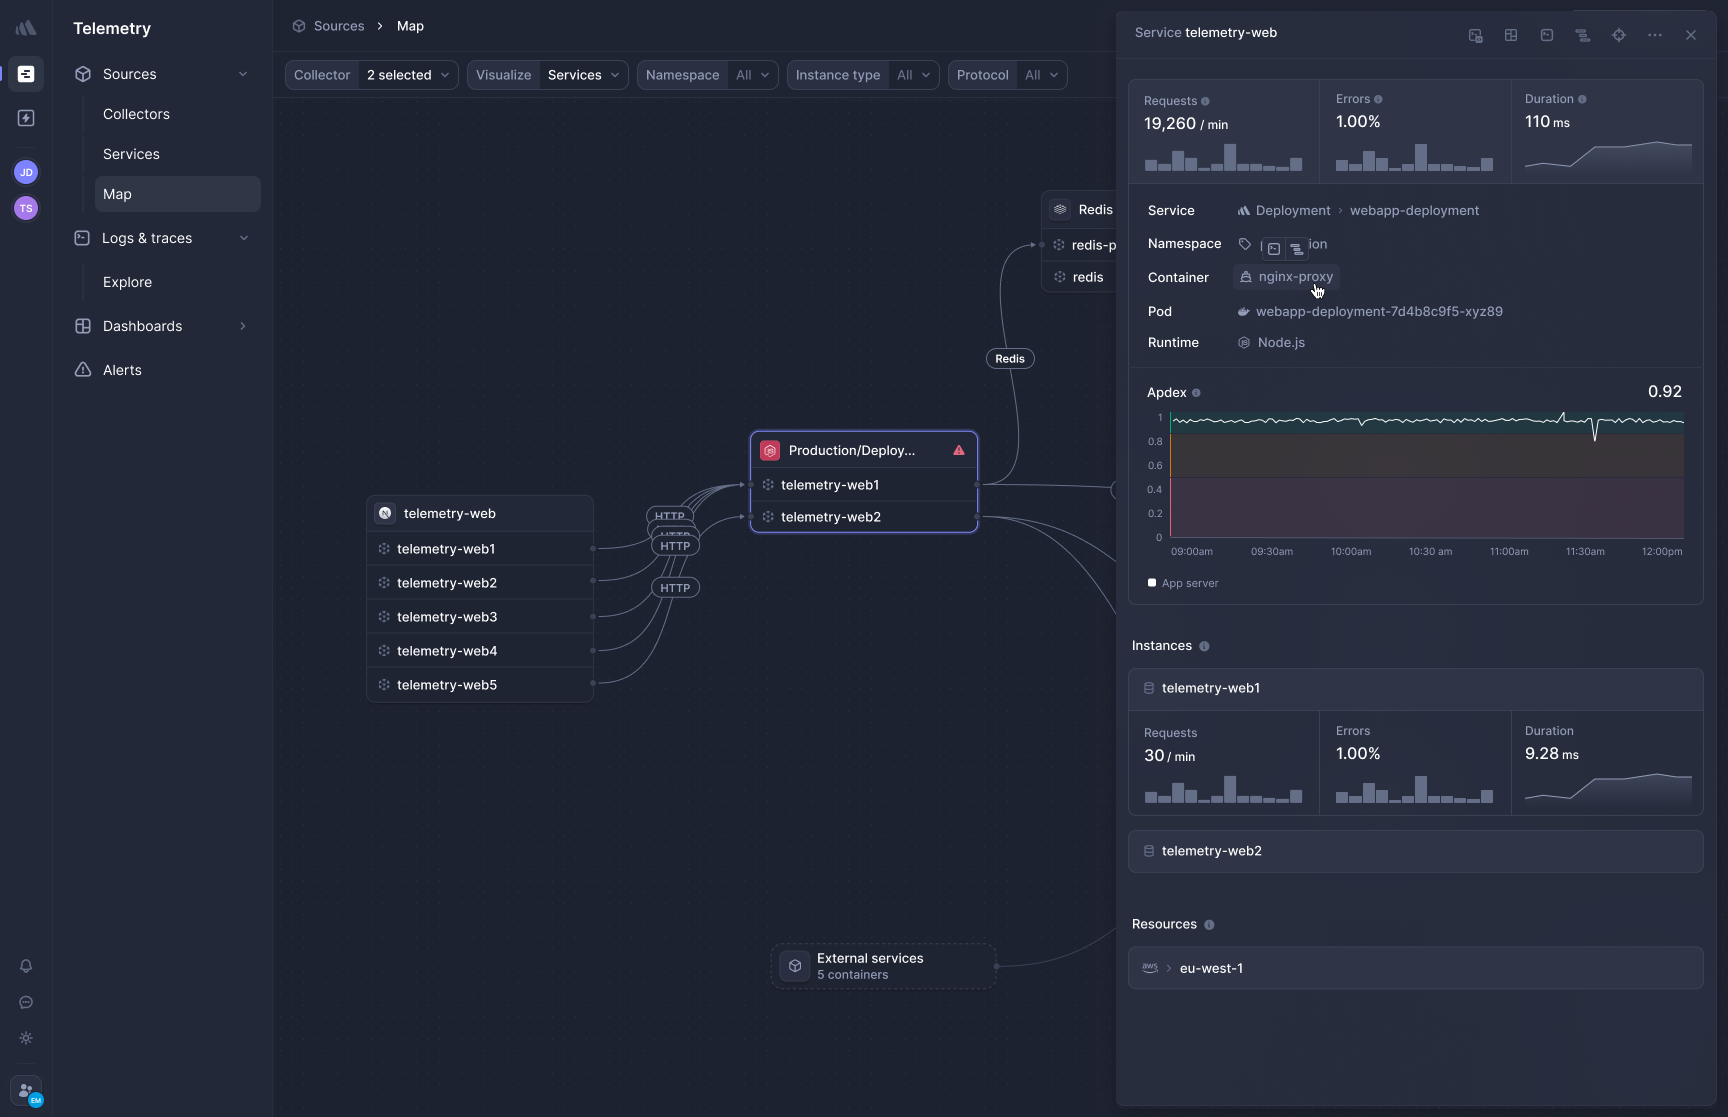
Better Stack's architecture is built around a single principle: every signal from your stack, whether a log line, a distributed trace, a browser session, or a monitor alert, lives in the same data layer and feeds the same operational loop. The eBPF collector deploys as a DaemonSet and captures HTTP/gRPC traffic, database queries, and process-level data without application code changes. Watch how collection works end-to-end:
**ClickHouse-powered storage** means every ingested log is immediately searchable via SQL with no indexing decisions, no tiering, no rehydration latency. The same query language works on logs, traces, and metrics.
**Operational completeness** is the differentiator. When an alert fires, Better Stack doesn't hand off to PagerDuty. The on-call schedule, escalation policy, Slack incident channel, and customer status page are all part of the same platform. The investigation workflow connects a failing trace to the infrastructure event behind it and the error that triggered the alert, all in one interface.
**OpenTelemetry-native collection** accepts data from your existing OTel collector without vendor lock-in. If you instrument once with OTel, you own that instrumentation regardless of where you send the data.
### Axiom: purpose-built event data platform
Axiom's architecture is genuinely innovative. EventDB, their proprietary columnar store, achieves compression ratios of 25-50x during ingestion, which is why a team storing petabytes of event data at Axiom can do so at a fraction of what traditional logging platforms charge. MetricsDB, now generally available, extends this to time-series data with a purpose-built architecture that treats high cardinality as a design principle rather than a billing problem.
**APL (Axiom Processing Language)** is a pipeline-based query language that is readable and composable. It is more powerful than SQL for complex event analysis and more expressive than PromQL for time-series operations. Teams with large-scale data needs often prefer it once they invest in learning it.
**Spotlight** is Axiom's AI-powered investigation tool that surfaces anomalies and generates summaries alongside visualizations. It shifts the workflow from reactive query-building toward proactive pattern recognition.
**MCP server** connects Claude, Cursor, and other AI assistants directly to your Axiom datasets. The implementation is thoughtful: it defaults to CSV over JSON to reduce token usage, uses heuristic field scoring to prioritize the most relevant columns, and supports tools for anomaly detection, cross-dataset correlation, and performance baseline analysis.
What Axiom does not provide: on-call scheduling, phone/SMS alerting, incident management, status pages, error tracking, RUM, or uptime monitoring. These are not gaps in Axiom's roadmap; they are outside its stated scope. Axiom is an event data platform. Better Stack is an observability and incident operations platform. Teams choosing Axiom for its cost efficiency and query performance typically pair it with PagerDuty or OpsGenie for incidents and a separate tool for status pages.
| Architecture aspect | Better Stack | Axiom |
|---|---|---|
| **Storage engine** | ClickHouse (logs/traces) | EventDB + MetricsDB (proprietary) |
| **Compression** | High | 95%+ (industry-leading) |
| **Query language** | SQL + PromQL | APL + MPL (metrics preview) |
| **Zero-code instrumentation** | Yes (eBPF collector) | No (OTel SDK required) |
| **OpenTelemetry** | Native, first-class | Native, first-class |
| **Incident operations** | Full (on-call, paging, status pages) | Not in scope |
| **MCP server** | GA | GA |
| **AI investigation** | AI SRE | Spotlight |
## Pricing comparison
Axiom's pricing model is usage-based and genuinely transparent. Better Stack's pricing is also usage-based but structured differently, combining a per-responder model with telemetry bundles. The right comparison depends on what features you actually need from each platform, because Axiom does not include incident management, and Better Stack's responder pricing is what funds that entire operational layer.
### Better Stack: volume plus operations
Better Stack charges for telemetry volume and operational capacity separately, which means the pricing model reflects what you're actually using.
**Pricing structure:**
- Telemetry bundles: $25/month (billed annually) for 40 GB each of logs, traces, and metrics
- Logs: $0.10/GB ingestion + $0.05/GB/month retention
- Traces: $0.10/GB ingestion + $0.05/GB/month retention
- Metrics: $0.50/GB/month
- Error tracking: $0.000050 per exception
- Responders (phone/SMS + on-call): $29/month each
- Monitors: $0.21/month each
- RUM: $0.00150/session replay
**Free plan:** 3 GB logs/traces/metrics, 100,000 exceptions/month, 5,000 session replays, 10 monitors, incident management, no credit card required.
The responder fee is worth examining directly. At $29/month per responder, a five-person on-call rotation costs $145/month. That price includes unlimited phone calls and SMS, on-call scheduling, multi-tier escalation policies, Slack-native incident management, post-mortem generation, and status page publishing. Teams currently paying PagerDuty or OpsGenie on top of their observability platform will typically come out ahead.
### Axiom: compute credits and storage
Axiom prices around compute and storage with automatic volume discounts that kick in without negotiation.
**Pricing structure:**
- Platform fee: $25/month base
- Data loading compute: 0.06–0.12 credits/GB (decreasing with volume; 1,000 GB/month free)
- Query compute: 0.08–0.20 credits/GB-hour (100 GB-hours/month free)
- Storage: $0.030/GB/month (100 GB free)
- Enterprise add-ons: SSO $100/month, Directory Sync $100/month, RBAC $50/month, Audit Logs $50/month
- HIPAA: available with NDA and minimum annual spend
At 1 TB/month ingestion with 12-month retention, the estimated monthly cost runs around $60–80 for telemetry alone. What this does not include: incident management, on-call scheduling, phone/SMS alerting, status pages, error tracking, or RUM. Teams selecting Axiom for its cost efficiency on telemetry should budget separately for those operational functions. PagerDuty's standard plan starts at $21/user/month; Atlassian Statuspage starts at $29/month. A direct total-cost comparison requires adding those tools back in.
### Cost comparison: 3-year TCO
For a team with 100 services, 5 on-call responders, and 2TB/month log volume:
| Category | Better Stack | Axiom (telemetry only) | Axiom (full stack) |
|---|---|---|---|
| **Telemetry (logs, traces, metrics)** | $18,000 | $7,200 | $7,200 |
| **Incident management** | Included | Not included | $30,240 (PagerDuty) |
| **Status pages** | Included | Not included | $1,044 (Atlassian) |
| **Error tracking** | $9,000 | Not included | $10,800 (Sentry) |
| **Total (3 years)** | ~$47,820 | ~$21,600 | ~$71,484 |
The Axiom-only telemetry number looks compelling. The full-stack number, with the tools you need to actually operate production systems, tips in Better Stack's favor. Whether that math applies to your team depends on which operational tools you already pay for and whether consolidating them has value beyond cost.
## Distributed traces
Distributed tracing is where the instrumentation philosophy difference becomes most tangible. Better Stack captures traces at the kernel level; Axiom requires OTel instrumentation. Both end up with OpenTelemetry-format data, but the path to get there differs significantly.
### Better Stack: eBPF-based tracing
[Better Stack's APM](https://betterstack.com/tracing) captures distributed traces using eBPF without requiring SDK installation, library updates, or per-service configuration. Watch how the tracing experience works:
Deploy to Kubernetes via Helm, and HTTP/gRPC traffic between services is captured immediately. Database queries to PostgreSQL, MySQL, Redis, and MongoDB are traced automatically with no per-database configuration.
**Frontend-to-backend correlation** connects browser sessions to backend traces in one view. When a page load degrades, the trace from the initial request through the service graph and into database calls is visible without switching products, because RUM, tracing, and logs share the same data layer.
**OpenTelemetry-native, zero lock-in.** Traces are stored in OTel format. Changing your telemetry destination means changing a configuration line, not reinstrumenting your codebase. How much instrumentation debt has accumulated in your current stack from proprietary agents you cannot easily remove?
**Polyglot environments** benefit specifically from eBPF. When you run Python, Go, Java, Ruby, and Node.js side by side, maintaining separate OTel SDK versions and environment variables per language adds real maintenance overhead. eBPF eliminates that problem entirely.
### Axiom: OTel-native tracing with waterfall views

Axiom's tracing support is full-featured and OTel-native. The Console includes a dedicated waterfall view for traces, an interactive service map, and the ability to query spans using APL. Cross-signal correlation is a first-class feature: Axiom automatically detects trace IDs in any field containing "trace" in its name, which means logs from custom field naming conventions correlate to traces without manual configuration.
What differentiates Axiom's trace experience is the query layer. APL can express complex span-level aggregations, latency percentiles, and cross-dataset patterns that SQL cannot represent as elegantly. For teams doing heavy trace analysis, particularly in AI engineering contexts where cost-per-token and latency distributions matter, APL is a genuine advantage.
The limitation is instrumentation overhead. Every service needs OTel SDK installation and configuration. In a polyglot monorepo, that means maintaining SDKs for multiple languages, coordinating version updates, and dealing with differences in what each language SDK captures. Axiom's documentation and community support are strong here, but the operational lift is real.
| Tracing feature | Better Stack | Axiom |
|---|---|---|
| **Instrumentation method** | eBPF (kernel-level, zero code) | OTel SDK (per service) |
| **Database tracing** | Automatic (Postgres, MySQL, Redis, Mongo) | Via OTel SDK configuration |
| **Frontend-to-backend** | Unified (same data layer, one interface) | Not available (no RUM) |
| **OTel compatibility** | Native | Native |
| **Trace query language** | SQL | APL (more expressive for complex analysis) |
| **Waterfall view** | Yes | Yes |
| **Cross-signal correlation** | Automatic with logs, metrics, errors, incidents | Automatic with logs and metrics |
## Volumetric logging
Both platforms are built around the premise that you should be able to keep all your logs, query all of them, and do so without per-log indexing fees or forced sampling. The differences are in query language, ecosystem integration, and what the logs connect to.
### Better Stack: SQL-powered log management
[Better Stack logs](https://betterstack.com/logs) treats every ingested log as a structured event in ClickHouse. 100% of ingested logs are immediately searchable with no indexing decisions and no tiering.
Watch how Live Tail provides real-time streaming with filtering:
Query familiar syntax:
```sql
SELECT
service_name,
COUNT(*) as error_count,
AVG(duration_ms) as avg_duration
FROM logs
WHERE level = 'error'
AND timestamp > NOW() - INTERVAL '1 hour'
GROUP BY service_name
ORDER BY error_count DESC
```
Build charts directly from log queries:
Save frequently used queries as presets for faster investigation:
**Pricing:** $0.10/GB ingestion + $0.05/GB/month retention. No indexing fees, no tiers, no rehydration costs.
**Integration:** Better Stack connects natively to OpenTelemetry collectors, Vector log pipelines, Prometheus exporters, Kubernetes, Docker, PostgreSQL, MySQL, Redis, MongoDB, and Nginx. The [MCP server](https://betterstack.com/docs/getting-started/integrations/mcp/) lets Claude, Cursor, and other AI assistants query logs directly with natural language.
### Axiom: APL-powered event analytics

Axiom's EventDB achieves 25-50x compression during ingestion and sub-second query latency at petabyte scale. The 95%+ compression ratio the company reports translates directly into storage cost efficiency. Is your team currently paying for log storage at uncompressed rates? That's where Axiom's architecture creates its most compelling cost argument.
APL offers capabilities that SQL does not. Pipeline-style transformations, complex temporal aggregations, and streaming queries compose naturally in APL in a way that requires verbose subqueries in SQL. For engineering teams analyzing AI model costs across thousands of traces, or tracking latency distributions across millions of events with custom field breakdowns, APL can express those analyses more concisely.
Axiom's integration story is strong for developer-oriented stacks: OpenTelemetry, Vercel, Cloudflare, AWS Lambda, and Fluent Bit all have first-class support. The breadth of supported ingestion paths is a real advantage for edge-native and serverless architectures that Better Stack covers less specifically.
| Log management | Better Stack | Axiom |
|---|---|---|
| **Storage engine** | ClickHouse | EventDB (proprietary columnar) |
| **Query language** | SQL | APL |
| **Searchability** | 100%, immediate | 100%, immediate (no sampling) |
| **Compression** | High | 95%+ (25-50x during ingestion) |
| **Pricing** | $0.10/GB ingestion + $0.05/GB retention | Credits-based (1 TB/month included free) |
| **Indexing fees** | None | None |
| **Serverless/edge integrations** | Good | Excellent (Vercel, Cloudflare, Lambda native) |
| **AI assistant access** | MCP server (GA) | MCP server (GA) |
## High-cardinality metrics
The arrival of Axiom's MetricsDB at general availability is the biggest product development in this comparison. For years, Axiom's main gap relative to full observability platforms was metrics. That gap is now closed.
### Better Stack: PromQL and no cardinality penalties
[Better Stack metrics](https://betterstack.com/infrastructure-monitoring) charges based on data volume, not unique metric combinations. Adding a high-cardinality tag like `customer_id` changes your storage costs linearly. It does not trigger exponential billing.
Watch how to build metrics dashboards:
For teams already using Prometheus, PromQL works natively:
Or use drag-and-drop chart building without writing queries:
**Cardinality optimization** matters even with flat pricing. Here's how to manage it for better query performance:
### Axiom: MetricsDB with hyper-cardinality by design

Axiom's MetricsDB is architecturally distinct from typical metrics stores. Rather than fighting cardinality as a cost problem, MetricsDB is engineered from the ground up to handle billions of unique time series. The storage model applies the same object storage and ephemeral compute approach that makes EventDB efficient, with no active series limits and billing per GB rather than per series.
This matters for GPU-intensive AI deployments, multi-tenant SaaS platforms, and any environment where tracking per-container, per-service-instance, or per-customer metrics creates the kind of cardinality explosion that would generate a shocking invoice from Prometheus-based SaaS tools.
MPL (Metrics Processing Language), currently in preview alongside the GA release, is a pipeline-based, code-first query language for time-series operations designed to be readable by humans and composable by AI agents. For teams querying metrics through MCP-connected AI assistants, this matters.
The practical difference between the two platforms on metrics comes down to query language preference and integration depth. Are you already comfortable with APL and want metrics in the same query interface? Axiom. Do you prefer PromQL and want metrics integrated with on-call workflows? Better Stack.
| Metrics | Better Stack | Axiom |
|---|---|---|
| **Storage** | Prometheus-compatible | MetricsDB (purpose-built) |
| **Cardinality pricing** | Volume-based, no penalties | No active series limits, volume-based |
| **Query language** | PromQL | APL + MPL (preview) |
| **OpenTelemetry metrics** | Native | Native |
| **AI agent access** | MCP server (GA) | MCP server (GA, metrics skill included) |
| **Dashboards** | Drag-and-drop + PromQL + SQL | Query builder with AI-generated dashboards |
## Incident management
This section does not require a detailed Axiom comparison because Axiom does not have incident management. The question for teams evaluating both platforms is whether the cost of adding a dedicated incident management tool on top of Axiom's telemetry pricing exceeds the cost of Better Stack's all-in-one approach.
### Better Stack: end-to-end incident operations
[Better Stack incident management](https://betterstack.com/incident-management) includes on-call scheduling, unlimited phone/SMS alerts, escalation policies, Slack-native incident channels, post-mortem generation, and status page publishing at $29/month per responder.
Overview of the full incident lifecycle:
Slack-based incident response with dedicated channels:
On-call rotation setup:
Automatic post-mortem generation from incident timelines:
Advanced escalation policies for enterprise teams:
**AI SRE** activates autonomously when an incident fires. It analyzes the service map, queries logs for error patterns, reviews recent deployments, and presents a root cause hypothesis before the on-call engineer has finished reading the alert. At 3am, starting with a hypothesis instead of a blank log search window is meaningful.
### Axiom: no incident management
Axiom does not offer on-call scheduling, phone alerting, escalation policies, incident channels, or post-mortems. Monitors and alerting exist within Axiom's product, but the operational workflow that follows an alert is outside the platform's scope.
Teams using Axiom for observability typically integrate PagerDuty ($21+/user/month), OpsGenie ($9+/user/month), or incident.io ($25–45/user/month) for incident operations. These are capable tools, and teams with existing investments in them may prefer to keep them. The question is whether a new tool evaluation should start from a unified platform or from a best-of-breed assembly.
| Incident feature | Better Stack | Axiom |
|---|---|---|
| **On-call scheduling** | Built-in | Not available |
| **Phone/SMS alerts** | Unlimited (included) | Not available |
| **Escalation policies** | Multi-tier, time-based | Not available |
| **Slack incident channels** | Native | Not available |
| **Post-mortems** | Automatic from timelines | Not available |
| **AI SRE** | Yes (autonomous investigation) | Not available |
| **Monthly cost (5 responders)** | $145 | Requires third-party ($105–225) |
## AI observability and MCP
Both platforms have made serious investments in AI-native workflows, and the comparison here is more nuanced than the incident management one: Axiom has distinct strengths in AI engineering use cases that Better Stack does not yet match.
### Better Stack: AI SRE and MCP
Better Stack's **MCP server** is generally available and connects Claude, Cursor, and any MCP-compatible AI client directly to your observability data. Configure it with one JSON block:
```json
{
"mcpServers": {
"betterstack": {
"type": "http",
"url": "https://mcp.betterstack.com"
}
}
}
```
From there, natural language queries work across the full platform: "show me all monitors currently down," "who's on-call right now?", "build a chart of HTTP 500 errors for the last hour," or "create a dashboard for my API error rates." The MCP server covers uptime monitoring, incident management, log querying, metrics, dashboards, error tracking, and on-call scheduling. You can restrict it to read-only operations or allowlist specific tools.
The **AI SRE** adds autonomous investigation during incidents. It is not a query assistant; it is an agent that activates during incidents, looks at your service map, reviews recent deployments, queries recent errors, and returns a structured hypothesis. The difference between a query assistant and an autonomous investigator is the difference between Spotlight (Axiom's AI layer) and an on-call engineer with AI tools.
### Axiom: MCP, Spotlight, and AI engineering
Axiom's **MCP server** is also GA and notably well-engineered for LLM consumption. The "compact by default" philosophy, preferring CSV over JSON, using a global cell budget to cap context window usage, and applying heuristic field scoring to surface the most relevant columns, reflects real engineering work done to make the server useful in production rather than just functional in demos.
The MCP server supports tools including dataset querying, anomaly detection, performance baseline analysis, cross-dataset event correlation, and monitor health analysis. For teams building AI workflows into production, this is a serious implementation.
**Spotlight** is Axiom's proactive investigation layer. It analyzes datasets and surfaces anomalies alongside AI-generated summaries, reducing the time from "something looks wrong" to "here is what is wrong and why." Unlike traditional dashboards where you need to know what question to ask, Spotlight asks questions on your behalf.
**AI engineering observability** is a genuine Axiom differentiator. The platform includes purpose-built features for teams shipping generative AI: tracking cost and latency per LLM provider, tracing multi-step agent workflows, capturing prompt/completion data with OTel semantic conventions for AI operations, running offline evaluations against curated test sets, and scoring AI outputs on live production traffic with reference-free scorers. GenAI functions in APL extract user prompts, calculate costs, and analyze conversation flow without manual JSON parsing. How much of your current debugging time for AI features is spent unpacking JSON payloads manually?
Better Stack covers AI engineering observability through its tracing and log infrastructure but does not have the same dedicated toolkit for prompt evaluation, agent workflow tracing, or LLM cost tracking.
| AI capability | Better Stack | Axiom |
|---|---|---|
| **MCP server** | GA | GA |
| **AI-assisted investigation** | AI SRE (autonomous, activates during incidents) | Spotlight (proactive anomaly surface) |
| **Natural language queries** | Via MCP across full platform | Via MCP, APL, and AI-generated dashboards |
| **AI engineering observability** | Via logs and traces | Purpose-built: cost tracking, prompt eval, agent tracing |
| **LLM cost/latency tracking** | Not purpose-built | Native with AI SDK integration |
| **Offline evaluations** | Not available | Available |
| **MCP design philosophy** | Broad operational access | Compact-by-default, LLM-optimized payloads |
## Status pages and customer communication
### Better Stack: built-in, multi-channel
[Better Stack Status Pages](https://betterstack.com/status-pages) sync automatically with the incident management layer. When an incident fires, the status page updates without manual action.
Features include public and private pages, custom domains, email/SMS/Slack/webhook subscriber notifications, scheduled maintenance windows, password or SSO-protected private pages, and multi-language support. Advanced features are priced at $12–208/month, with the core status page included in the incident management platform.
### Axiom: not in scope
Axiom does not offer status pages. Teams using Axiom need a separate tool, most commonly Atlassian Statuspage ($29/month), BetterUptime, or a self-hosted option.
| Status pages | Better Stack | Axiom |
|---|---|---|
| **Available** | Yes, built-in | No |
| **Incident sync** | Automatic | N/A |
| **Subscriber channels** | Email, SMS, Slack, webhook | N/A |
| **Custom domains** | Yes | N/A |
| **Pricing** | Included with incident management | Separate tool required |
## Error tracking
### Better Stack

[Better Stack Error Tracking](https://betterstack.com/error-tracking) accepts Sentry SDK payloads, which means teams migrating from Sentry can redirect data without reinstrumenting. Each error links to its full distributed trace, showing the request flow that produced the exception. AI-native debugging via Claude Code and Cursor integration provides pre-built prompts that summarize error context for direct use in your coding agent.
### Axiom: not in scope
Axiom does not have a dedicated error tracking product. Error data can be queried through logs, but grouping, deduplication, assignment, and regression detection are not provided.
| Error tracking | Better Stack | Axiom |
|---|---|---|
| **Available** | Yes, built-in | Partial (via log queries) |
| **Sentry SDK** | First-class support | N/A |
| **Trace correlation** | Automatic | Not available |
| **AI debugging prompts** | Claude Code + Cursor | N/A |
| **Pricing** | $0.000050/exception | N/A |
## Real user monitoring
### Better Stack: unified RUM

Better Stack RUM captures frontend sessions, JavaScript errors, Core Web Vitals (LCP, CLS, INP), website analytics, and product funnel data. Because it shares the same data warehouse as backend telemetry, a session replay, the JavaScript error that occurred during it, and the backend trace that caused the error are all visible in the same interface with the same SQL query language.
Session replay supports 2x playback with rage click and dead click filtering. Website analytics tracks referrers, UTM campaigns, entry/exit pages, and real-time traffic sources. Product analytics auto-captures user events for funnel analysis without pre-instrumentation.
**Pricing:** $0.00150/session replay, volume-based with no per-session indexing surprises.
### Axiom: not in scope
Axiom does not offer RUM or session replay.
| RUM | Better Stack | Axiom |
|---|---|---|
| **Available** | Yes | No |
| **Session replay** | Yes | N/A |
| **Core Web Vitals** | Yes (LCP, CLS, INP) | N/A |
| **Frontend-to-backend** | Unified (same data layer) | N/A |
| **Product analytics** | Yes (auto-captured events, funnels) | N/A |
## Enterprise readiness
### Better Stack
Better Stack covers the compliance and access control requirements most enterprise procurement processes check: SOC 2 Type II, GDPR, SSO via Okta/Azure/Google, SCIM provisioning, RBAC, audit logs, and data residency in EU and US regions with an optional self-hosted S3 bucket option. Enterprise customers receive a dedicated Slack support channel and named account manager.
What Better Stack does not have is HIPAA certification. If your organization operates in healthcare or processes PHI, that matters for vendor selection.
### Axiom
Axiom's enterprise feature set is available as paid add-ons rather than bundled into enterprise tiers: SSO at $100/month, Directory Sync at $100/month, RBAC at $50/month, Audit Logs at $50/month. The SOC 2 Type II report and HIPAA BAA are both available, but require an NDA and a minimum annual spend commitment.
The HIPAA coverage is a real advantage over Better Stack for healthcare teams. Axiom also offers a named support engineer as an add-on, though not in the same always-included model that Better Stack provides for enterprise accounts.
| Enterprise feature | Better Stack | Axiom |
|---|---|---|
| **SOC 2 Type II** | ✓ | ✓ |
| **GDPR** | ✓ | ✓ |
| **HIPAA** | ✗ | ✓ (with NDA, min annual spend) |
| **SSO (SAML/OIDC)** | ✓ (included) | ✓ ($100/month add-on) |
| **SCIM/Directory Sync** | ✓ (included) | ✓ ($100/month add-on) |
| **RBAC** | ✓ (included) | ✓ ($50/month add-on) |
| **Audit logs** | ✓ (included) | ✓ ($50/month add-on) |
| **Data residency** | EU + US + optional S3 | US + EU regions |
| **Dedicated support channel** | Slack + account manager (included) | Named engineer (add-on) |
| **SLA** | Enterprise SLA available | Enterprise SLA available |
| **Self-hosted data** | Optional (your S3 bucket) | Cloud-hosted only |
### Enterprise checklist
| Requirement | Better Stack | Axiom |
|---|---|---|
| SOC 2 Type II | ✓ | ✓ |
| GDPR | ✓ | ✓ |
| HIPAA | ✗ | ✓ |
| FedRAMP | ✗ | ✗ |
| SSO included | ✓ | Add-on |
| SCIM included | ✓ | Add-on |
| RBAC included | ✓ | Add-on |
| Audit logs included | ✓ | Add-on |
| Data residency options | EU + US + S3 | EU + US |
| Dedicated Slack support | ✓ | Add-on |
| Named account manager | ✓ | Add-on |
## Final thoughts
Better Stack stands out because it **removes entire layers of operational complexity**.
With **eBPF-based auto-instrumentation**, teams do not need to maintain SDKs across languages. With **logs, traces, metrics, errors, RUM, on-call, and incident workflows in one platform**, there is no need to stitch together multiple tools. And when something breaks, **the AI SRE activates automatically, surfaces a root cause hypothesis, and feeds directly into the same incident workflow your team uses to respond**.
This is where the difference shows up in practice. Instead of moving between dashboards, alerting tools, and status pages, **everything from detection to resolution happens in one place**. That translates directly into **fewer context switches, faster response times, and more predictable costs**.
Axiom is still a strong option in a narrower scenario. If your deeply focused on **LLM observability, prompt evaluation, and high-cardinality telemetry**, and you already have incident management solved elsewhere, it offers specialized capabilities that may fit that need well.
But for most, the decision is not about having the best telemetry engine. It is about **reducing the number of tools and making incidents easier to handle end to end**.
**Better Stack delivers that as a single system**, not a collection of parts.
eady to see it in action? [Start your free trial](https://betterstack.com) with no credit card required.