# Better Stack vs Airbrake: A Complete Comparison for 2026
Most teams start using Airbrake for a simple reason: it’s fast to set up and easy to trust. Add the SDK, deploy your app, and error reports start showing up almost immediately. That simplicity is still **one of Airbrake’s biggest strengths**. For teams that mainly need reliable exception tracking, it does the job well without adding much complexity.
But modern applications rarely stay simple for long. As systems grow across multiple services, languages, and cloud environments, teams usually need more than error reporting. They need **logs, tracing, uptime monitoring, incident response, and visibility across the entire stack**.
That’s where Better Stack takes a different approach. Instead of focusing only on exceptions, **it combines logs, metrics, traces, error tracking, incident management, and status pages into one platform**. The goal is not just to report failures, but to help teams **understand, investigate, and resolve issues faster**.
This comparison is not about declaring one platform universally better. **Airbrake remains a strong and focused error tracking tool** with a clean developer experience and reliable deploy tracking. Better Stack simply covers a much broader observability workflow.
So the real question is whether your team still only needs **basic error monitoring**, or whether you’ve reached the point where a **full observability platform** makes more sense. This guide looks at both platforms honestly, including where each one performs best and where the trade-offs become clear.
## Quick comparison at a glance
| Category | Better Stack | Airbrake |
|----------|-------------|---------|
| **Core scope** | Full-stack observability (logs, metrics, traces, errors, incidents, status pages) | Error monitoring + performance monitoring |
| **Instrumentation** | eBPF zero-code + Sentry-SDK compatible error tracking | SDK-per-language (notifier install required) |
| **APM depth** | Distributed tracing, service maps, frontend-to-backend | Route-level latency, Apdex score, HTTP requests |
| **Log management** | Built-in, 100% searchable via SQL | Not included (external logs required) |
| **Infrastructure monitoring** | Built-in metrics, PromQL, dashboards | Not included |
| **Incident management** | On-call scheduling, phone/SMS, escalation policies | Not included |
| **Status pages** | Included | Not included |
| **Pricing model** | Data volume + responders | Per-error-volume tier |
| **Free plan** | Yes (error tracking included) | 14-day trial only |
| **OpenTelemetry** | Native, first-class | Not supported |
| **Enterprise: SSO, SCIM, RBAC, audit logs** | Yes | Audit logs on Pro tier; SSO via GitHub/Okta |
| **Data residency** | EU + US regions, optional S3 | Airbrake-hosted only |
---
## Platform architecture
Airbrake is a purpose-built exception tracker. You install a lightweight notifier in your application, it captures errors and performance events, and those go into Airbrake's SaaS backend. The design philosophy is narrow: do error and performance monitoring well, stay out of the way, and install in under three minutes. For teams that want exactly that, the architecture delivers.
Better Stack takes a different approach: a unified data warehouse that stores logs, metrics, and traces together, queryable with a single language (SQL or PromQL), surfaced through one interface. Error tracking sits inside this same platform, which means an exception links automatically to its surrounding log context and the distributed trace that produced it, without any manual correlation.
### Better Stack: unified telemetry
Better Stack's architecture is built on three layers: an eBPF-based collector that captures telemetry at the kernel level, a unified storage engine that keeps all signal types together, and a single interface for investigation.
Watch how the collector discovers services and starts capturing data automatically:
The eBPF collector runs at the kernel level on each node, capturing HTTP traffic, database queries (PostgreSQL, MySQL, Redis, MongoDB), and service-to-service calls without touching application code. For error tracking specifically, Better Stack accepts Sentry SDK payloads, so teams migrating from Airbrake or Sentry can redirect their existing instrumentation without rewriting notifiers.
**Unified storage** means every error, log line, and trace span lives in the same data warehouse. When an exception fires, the surrounding logs and the trace that triggered it appear in the same view. No product switching, no manual correlation, no "let me check the logs in a separate tab."

### Airbrake: SDK-based exception collection
Airbrake's architecture centers on language-specific notifiers. You install the gem (Ruby), the npm package (Node/JavaScript), the pip package (Python), or the appropriate SDK for your stack, then configure it with your project API key. Errors are captured and sent to Airbrake's backend, grouped by type, and surfaced with stack traces and contextual metadata.

This approach is genuinely lightweight. Airbrake describes its notifiers as agentless and serverless, meaning there is no background process sitting on your host consuming resources. The notifier hooks into your runtime and fires when exceptions occur. For a single-language application where error tracking is the primary need, this is about as frictionless as it gets.
What Airbrake does not do architecturally: it stores only error and performance event data. Logs, infrastructure metrics, and distributed traces are outside its scope. If you want those, you integrate other tools. Airbrake does not position itself as a replacement for those tools; its product pages explicitly note that teams often run it "alongside other logging solutions."
| Architecture aspect | Better Stack | Airbrake |
|---------------------|--------------|---------|
| **Data types stored** | Logs, metrics, traces, errors together | Errors + performance events only |
| **Collector type** | eBPF (kernel-level) + Sentry-SDK compatible | Language SDK per service |
| **Query interface** | SQL + PromQL, unified | Error-specific filters |
| **Cross-signal correlation** | Automatic (error links to trace and logs) | Manual (requires external tools) |
| **OpenTelemetry support** | Native, first-class | Not supported |
| **Data ownership** | Host in your S3 bucket (optional) | Airbrake-hosted only |
| **Setup time** | Minutes (eBPF) or SDK redirect (Sentry-compatible) | Under 3 minutes per service |
---
## Pricing comparison
Airbrake prices on error volume: you choose a tier based on how many errors your application generates per month. The base plan is $19/month for 25,000 errors (one user). The Essential tier at $59/month covers 100,000 errors with unlimited users. The Startup tier at $129/month handles 300,000 errors, the Growth tier at $299/month covers 1 million, and the Business tier at $799/month handles 5 million. Annual billing knocks 10% off these figures. Overages are charged per error at on-demand rates based on your tier.
Better Stack prices on data volume across all signal types. Logs cost $0.10/GB ingested plus $0.05/GB/month retained. Traces use the same formula. Metrics are $0.50/GB/month. Error tracking is $0.000050 per exception. On-call responders are $29/month each. Monitors are $0.21/month each. There are no per-seat charges and no tier jumps.
### Better Stack: volume-based, no tier jumps
Better Stack's pricing model treats error tracking as one line item among several rather than the organizing principle of billing. Whether you generate 25,000 or 25 million errors, you pay the same per-exception rate: $0.000050. There are no tiers to graduate between, no spike forgiveness clauses (because overage spikes cost fractions of a cent per error, not percentage premiums), and no seat limits.
**For a team monitoring one application with 5 million errors per month:**
- Error tracking: $250
- 5 responders (on-call): $145
- 100 monitors: $21
- Telemetry (if using logs/traces): depends on volume
For pure error tracking at comparable volumes, Better Stack is competitive. Where it pulls decisively ahead is when you factor in what Airbrake's price does not cover: logs, metrics, traces, incidents, and status pages each require separate tools and separate invoices.
### Airbrake: tier-based error volume pricing
Airbrake's published pricing is straightforward:
| Plan | Monthly price | Error quota | Users |
|------|--------------|-------------|-------|
| Dev + errors | $19 | 25,000 | 1 |
| Essential | $59 | 100,000 | Unlimited |
| Startup | $129 | 300,000 | Unlimited |
| Growth | $299 | 1,000,000 | Unlimited |
| Business | $799 | 5,000,000 | Unlimited |
The Pro plan (starting at $76/month) adds audit logs and spike forgiveness, which prevents overage charges during unexpected traffic bursts. Annual billing saves 10% across all tiers.
**What Airbrake does not include:** log management, infrastructure metrics, distributed tracing, incident management, on-call scheduling, status pages, and uptime monitoring. Teams that need these alongside error tracking pay separately for each. A realistic "full observability" stack built around Airbrake typically adds Datadog, New Relic, or another platform on top, which compounds the total monthly cost considerably.
Is your current Airbrake bill the only monitoring invoice your team receives, or is it one of several?
### Cost comparison: 3-year TCO
For a team running one major application with ~1M errors/month, needing logs, on-call alerting, and status pages:
| Category | Better Stack | Airbrake + supplements |
|----------|-------------|----------------------|
| Error tracking (3 years) | $10,800 | $10,764 (Growth tier annual) |
| Log management | $7,200 (2TB/month) | $18,000+ (Datadog Logs or equivalent) |
| Incident management / on-call | $5,220 (5 responders) | $8,820+ (PagerDuty Standard) |
| Status pages | Included | $1,800+ (Statuspage.io) |
| Infrastructure metrics | Included | $5,400+ (external) |
| Engineering overhead | Low | High (multiple integrations) |
| **Total** | **~$23,220** | **~$44,784+** |
The comparison shifts further against Airbrake if your team currently runs Airbrake alongside Datadog or New Relic. In that scenario, you are paying both a per-error-volume fee and a full platform fee for the observability capabilities Airbrake does not cover.
---
## Error monitoring
Error monitoring is the core of Airbrake and one of several products inside Better Stack. Both platforms capture exceptions, group them intelligently, and surface stack traces with contextual metadata. The differences lie in depth of integration with the rest of your stack.
### Better Stack: Sentry-compatible with full observability context

[Better Stack Error Tracking](https://betterstack.com/error-tracking) accepts Sentry SDK payloads natively. If your application is already instrumented with an Airbrake notifier that sends data via the Airbrake V2 protocol (which many Sentry-compatible clients also understand), redirecting to Better Stack requires changing a configuration endpoint rather than rewriting instrumentation.
What distinguishes Better Stack's error tracking from a standalone error tracker is what surrounds each exception. Every error links to:
- The **distributed trace** that triggered it, showing the full request path across services
- The **surrounding log lines** from the same timeframe, without querying a separate product
- The **infrastructure metrics** for the host or pod where the exception occurred
**AI-native debugging** is built into the error view. Pre-made prompts summarize the error context for Claude Code or Cursor, so developers can paste the prompt directly into their AI coding agent and start resolving the issue without manually parsing stack traces.
**Incident escalation** flows from the error view into Better Stack's incident management. When an exception hits a threshold, it can trigger an on-call alert, create a Slack incident channel, and page the responsible engineer, all within the same platform.
### Airbrake: purpose-built error tracking with deploy correlation

Airbrake provides detailed stack traces, intelligent error grouping, and duplicate detection so teams are not overwhelmed by trivial errors or notification floods. The platform surfaces errors with full contextual metadata: environment variables, user information, request parameters, server hostname, browser, and country, depending on what the notifier captures.
**Hotspots** identify files and functions that generate the most errors across your codebase, flagging high-risk areas before they compound. This view is particularly useful when triaging a large backlog of grouped exceptions.
**Breadcrumbs** (available in the JavaScript notifier) capture the sequence of events leading up to an error, giving you a timeline of user actions, network requests, and console output that preceded the exception. Combined with code snapshots, this often eliminates the need to reproduce errors locally.
**Deploy tracking** is where Airbrake differentiates itself within its category. Deployment tracking routes issues to the right team and visualizes code improvements over time. The deploy bar graph overlays when code was shipped against when error rates spiked or dropped, making it easy to link a bad deploy to its resulting errors and a fix deploy to the subsequent decline. You can filter errors by deploy and trace back to the exact line of code introduced in a specific release.
**Aggregations** provide breakdowns of each error by environment, remote address, country, affected user, browser, and custom dimensions. Custom aggregations are available on paid plans for teams with domain-specific grouping needs.
What Airbrake does not provide: correlation with logs from the same request, links to distributed traces, or cross-service error context. Each error is self-contained within Airbrake's data model. If the stack trace does not tell you enough, you switch to your log platform to find the surrounding context.
| Error monitoring feature | Better Stack | Airbrake |
|--------------------------|--------------|---------|
| **Stack traces** | Yes | Yes |
| **Intelligent grouping** | Yes | Yes (with duplicate detection) |
| **Breadcrumbs** | Yes | Yes (JavaScript notifier) |
| **Deploy correlation** | Yes | Yes (strong, visual deploy bar) |
| **Hotspot analysis** | No | Yes (file/function level) |
| **Distributed trace link** | Automatic | Not available |
| **Log correlation** | Automatic (same platform) | Manual (external tool required) |
| **AI debugging prompts** | Claude Code + Cursor integration | Not available |
| **Sentry SDK support** | First-class | Native Airbrake notifiers (V2 protocol) |
| **Incident escalation** | Built-in | Via webhook to external tools |
| **Custom aggregations** | Yes | Yes (paid tiers) |
---
## Performance monitoring
Both platforms offer a form of performance monitoring, but the scope is meaningfully different. Airbrake's performance monitoring is route-centric: it tracks HTTP request latency, Apdex scores, error rates per route, and job performance for background workers. Better Stack's APM is distributed tracing: service maps, inter-service spans, database query traces, and frontend-to-backend correlation.
### Better Stack: distributed tracing with eBPF
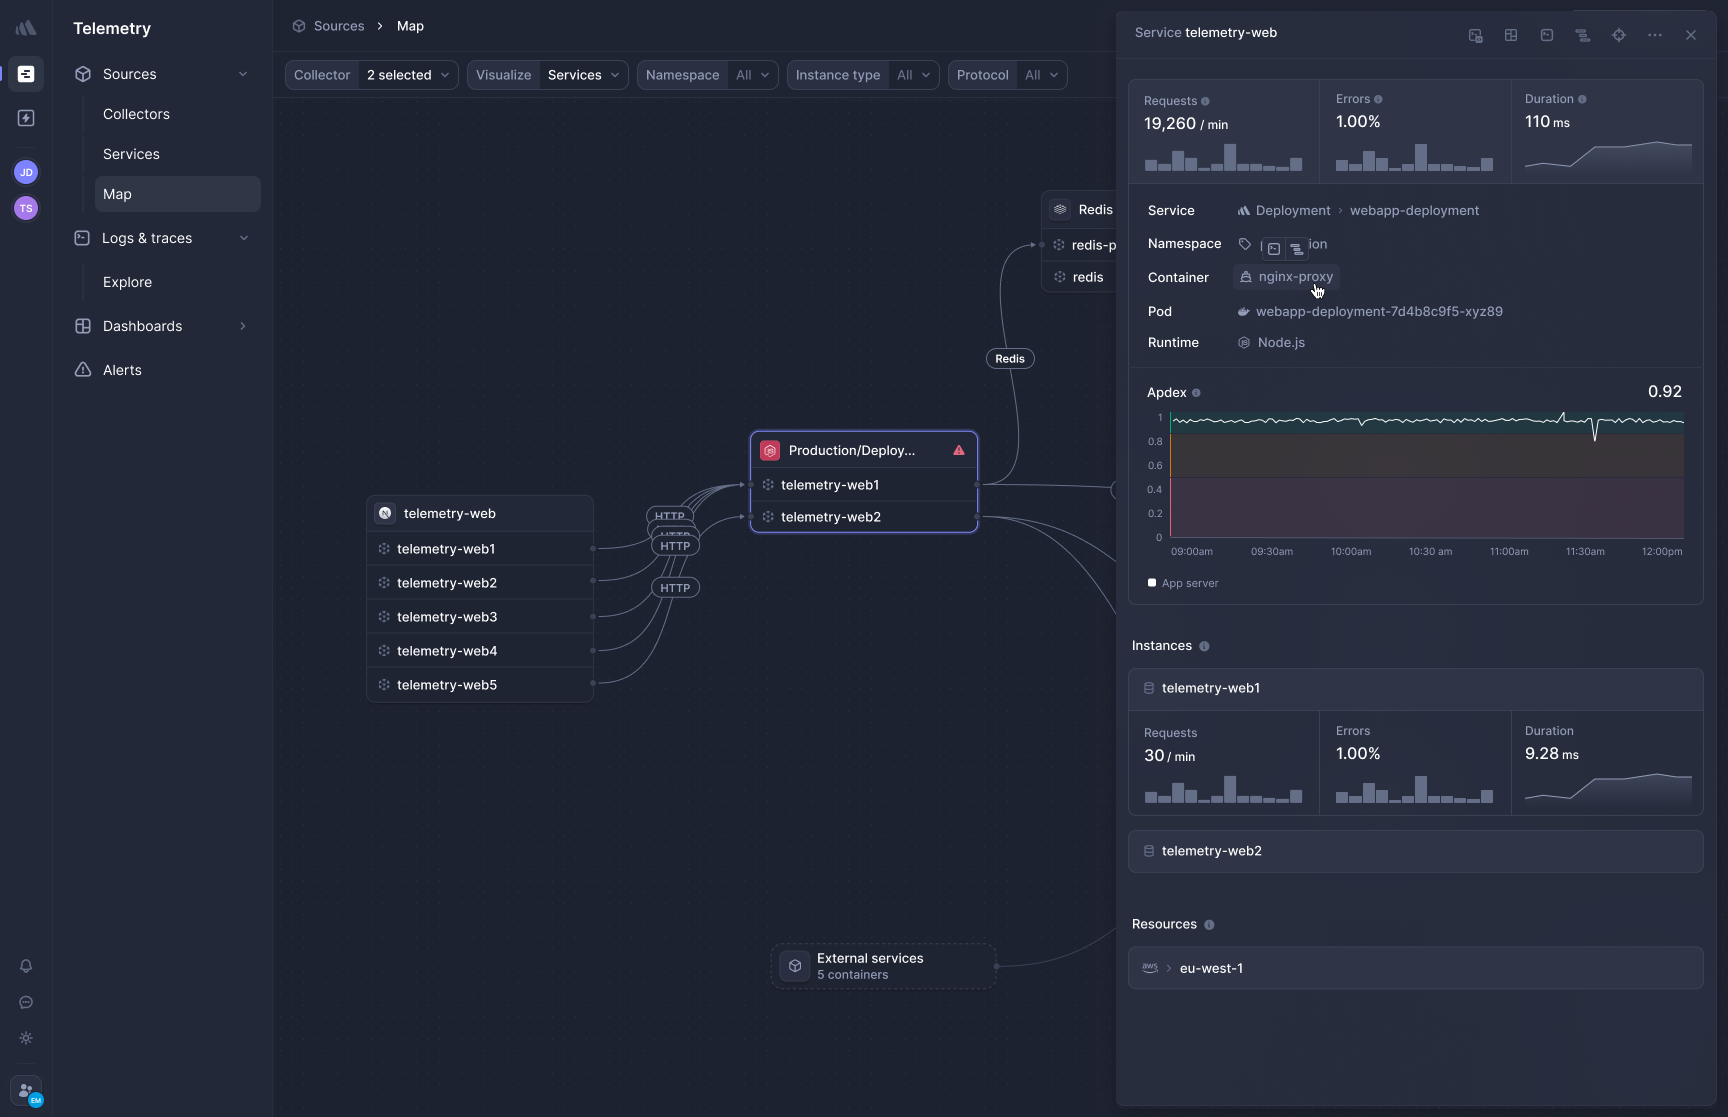
[Better Stack's APM](https://betterstack.com/tracing) captures distributed traces automatically via eBPF, without SDK instrumentation per service. Here's how it visualizes traces across a microservices architecture:
Deploy the collector to Kubernetes and HTTP/gRPC traffic between services is captured immediately. Database calls to PostgreSQL, MySQL, Redis, and MongoDB are traced automatically. There is no per-service instrumentation step because the collector works at the network layer, not the application layer.
**Frontend-to-backend correlation** connects user session data with backend traces. When a page load is slow, you can follow the request from the browser's initial fetch through each service hop and into the database query that delayed the response, all in a single view without switching products.
**OpenTelemetry-native, zero lock-in.** Traces use the OTel format natively. If your team already instruments services with OpenTelemetry SDKs, Better Stack ingests that data directly. If you later want to send traces elsewhere, you change a collector configuration, not application code. This is the opposite of the proprietary SDK lock-in that makes migration expensive on some platforms.
Does your team have uninstrumented services because someone hasn't gotten around to adding the SDK? That's the maintenance debt eBPF eliminates.
### Airbrake: route-level performance insight

Airbrake's Performance Dashboard provides route-level visibility: Apdex scores to measure user satisfaction, identification of slow or error-prone routes, and granular time breakdowns showing how long requests spend in the database, view layer, cache, and external requests.
The Apdex metric is a useful signal for teams that want a single aggregate health score without building custom dashboards. When a deploy drops Apdex below your target, Airbrake surfaces the affected routes ranked by impact, so you know where to investigate first.
Airbrake's Error Rate feature identifies the most error-prone routes, helping teams prioritize debugging efforts for routes that directly impact users. Job performance monitoring extends this to background workers, tracking queued jobs and surfacing worker failures alongside HTTP errors.
What Airbrake does not cover in performance monitoring: inter-service traces showing which downstream call caused a latency spike, database query-level traces identifying slow queries, or frontend performance metrics (Web Vitals, page load times). If a slowdown occurs inside a single service and affects a single route, Airbrake's APM will surface it. If it requires correlating behavior across three services, you need additional tooling.
| Performance monitoring | Better Stack | Airbrake |
|------------------------|--------------|---------|
| **Apdex score** | Via metrics | Yes, built-in |
| **Route-level latency** | Yes | Yes |
| **Distributed traces** | Yes (eBPF, automatic) | No |
| **Service maps** | Yes | No |
| **Database query traces** | Yes (auto-captured) | Partial (time in DB layer) |
| **Background job monitoring** | Yes | Yes |
| **Frontend-to-backend** | Yes (unified platform) | No |
| **OpenTelemetry support** | Native | Not supported |
| **Instrumentation required** | Zero (eBPF) | SDK per service |
---
## Deploy tracking
Deploy tracking is an area where Airbrake genuinely competes well. Its deploy visualization is clear, the correlation between releases and error rate changes is immediate, and the ability to filter all errors by deploy creates a focused debugging view that matters during a post-release triage.
### Better Stack: deploy tracking with observability context
Better Stack tracks deployments and correlates them with telemetry changes across logs, metrics, and errors. When a deploy lands, anomalies in error rates, latency, or log patterns appear against that deployment marker in the same timeline, without switching views.
**Integration with incident management** means a deploy that causes a spike in errors can trigger an on-call alert automatically. The deployment event appears in the incident timeline, giving responders immediate context for what changed before the incident began.
Watch how Better Stack connects telemetry sources to your deployment pipeline:
### Airbrake: best-in-class deploy visualization within error tracking

Airbrake's deploy tracking is its most distinctive feature relative to basic error trackers. The deploy bar graph shows when fixes were pushed and which errors occurred as a result of each deploy. You can filter the entire error list to a specific deployment window, see the exact error-per-deploy breakdown, and trace from an error back to the commit that introduced it via GitHub integration.
The deploy tab provides details including who pushed a deploy, when, and its error occurrence rate, with history available from one hour to 90 days depending on the plan. For teams practicing CI/CD with frequent releases, this granularity matters: you can distinguish between errors introduced by yesterday's deploy and errors that predate it, rather than looking at a flat error list.
The limitation is scope: deploy tracking in Airbrake is purely about errors. You do not see whether a deploy affected response times on uninstrumented services, increased log error rates in a sidecar container, or caused database query plans to change. Those signals require observability data Airbrake does not collect.
| Deploy tracking | Better Stack | Airbrake |
|-----------------|--------------|---------|
| **Error-to-deploy correlation** | Yes | Yes (visual, strong) |
| **Metrics correlation** | Yes | No |
| **Log correlation** | Yes | No |
| **Incident trigger on deploy anomaly** | Yes | Via webhook |
| **GitHub integration** | Yes | Yes |
| **Deploy filter on error list** | Yes | Yes |
| **Rollback insights** | Yes | Partial |
---
## Log management
This is the clearest gap between the two platforms. Better Stack treats log management as a core product. Airbrake does not include log management at all.
### Better Stack: all logs, fully searchable
[Better Stack logs](https://betterstack.com/logs) stores all ingested logs in a unified warehouse alongside metrics and traces. Every log is immediately searchable with no indexing tier, no decision about which logs to keep queryable, and no separate product to open.
Watch how Better Stack's Live Tail streams log events in real time:
SQL querying works across all log data:
```sql
SELECT
service_name,
COUNT(*) as error_count,
AVG(duration_ms) as avg_duration
FROM logs
WHERE level = 'error'
AND timestamp > NOW() - INTERVAL '1 hour'
GROUP BY service_name
ORDER BY error_count DESC
```
Building charts from log queries requires no additional configuration:
**Pricing:** $0.10/GB ingestion + $0.05/GB/month retention. A service generating 100GB monthly costs $15 total.
### Airbrake: no log management
Airbrake does not collect or store application logs. The platform's FAQ and documentation explicitly position it as a complement to logging tools, not a replacement. Users investigating errors in Airbrake must switch to a separate log platform (Papertrail, Loggly, Datadog Logs, or another) to find surrounding context.
This is a product choice, not a flaw. Airbrake stays focused on exceptions. But it does mean that every Airbrake deployment exists alongside a separate logging tool, with no automatic correlation between the two.
If you have ever caught an exception in Airbrake and then spent 15 minutes in your log platform piecing together what the application was doing before the error occurred, that context-switching overhead accumulates. How often does resolving an Airbrake error require opening a separate tool to understand what caused it?
| Log management | Better Stack | Airbrake |
|----------------|--------------|---------|
| **Included** | Yes | No |
| **Searchability** | 100% of ingested logs | N/A |
| **Query language** | SQL + PromQL | N/A |
| **Error correlation** | Automatic | Manual (external tool) |
| **Live streaming** | Yes | N/A |
| **Pricing** | $0.10/GB ingestion | N/A |
---
## Infrastructure monitoring
Neither platform is a Prometheus replacement, but the gap here tells the same story as log management: Better Stack includes it, Airbrake does not.
### Better Stack: metrics with no cardinality penalties
[Better Stack metrics](https://betterstack.com/infrastructure-monitoring) collects infrastructure metrics and stores them in the same data warehouse as logs and traces. Pricing is based on data volume, not unique metric combinations, so adding high-cardinality tags costs proportionally in storage, not exponentially in billing.
Watch how metrics dashboards are built in Better Stack:
Prometheus-compatible with full PromQL support:
### Airbrake: not in scope
Airbrake does not collect infrastructure metrics. Host CPU, memory, disk I/O, container resource consumption, and Kubernetes node health are outside its data model. Teams that need infrastructure visibility alongside error tracking use a separate monitoring platform.
This is consistent with Airbrake's positioning. It does not attempt to be an infrastructure monitoring tool. If your team is already running Prometheus/Grafana or another metrics platform and only needs error tracking on top, Airbrake's focused scope is appropriate.
| Infrastructure monitoring | Better Stack | Airbrake |
|--------------------------|--------------|---------|
| **Included** | Yes | No |
| **PromQL support** | Yes | No |
| **Cardinality pricing** | Volume-based (no penalty) | N/A |
| **Kubernetes metrics** | Yes | No |
| **Dashboard builder** | SQL + PromQL + drag-and-drop | N/A |
---
## Incident management
Airbrake can send webhook notifications when errors occur. It integrates with Slack, JIRA, GitHub, PagerDuty, and other tools for alerting. But the incident management workflow itself, on-call scheduling, escalation policies, phone/SMS delivery, and post-mortems, lives outside Airbrake.
Better Stack includes all of that.
### Better Stack: full incident lifecycle
[Better Stack incident management](https://betterstack.com/incident-management) includes on-call scheduling, escalation policies, unlimited phone and SMS alerts at $29/month per responder, Slack-native incident channels, and AI-powered investigation, with no additional tools required.
Here is how the full incident lifecycle works:
Slack-native incident management creates dedicated channels with investigation context built in:
On-call scheduling with rotation management and timezone-aware handoffs:
Automatic post-mortems generated from incident timelines:
### Airbrake: webhook-based alerting, external on-call required

Airbrake delivers real-time notifications via email, Slack, JIRA, GitHub, and custom webhooks when errors occur or thresholds are crossed. These integrations work well for routing error notifications into existing workflows.
What Airbrake does not provide: a built-in on-call schedule, phone or SMS delivery for critical alerts, escalation policies for when the primary responder does not acknowledge, or any structure for the incident lifecycle after the notification fires. Teams that need these capabilities integrate PagerDuty, OpsGenie, or a similar tool and connect it to Airbrake via webhook.
If your team is already running PagerDuty or similar, this is not a problem. If you are paying for Airbrake plus a separate on-call tool, that is a line item Better Stack eliminates.
| Incident management | Better Stack | Airbrake |
|--------------------|--------------|---------|
| **On-call scheduling** | Built-in | External tool required |
| **Phone/SMS alerts** | Unlimited ($29/responder/month) | Via PagerDuty/OpsGenie |
| **Escalation policies** | Built-in | External tool required |
| **Slack incident channels** | Native | Via integration |
| **Post-mortems** | Automatic + manual | Not included |
| **AI investigation** | Built-in (AI SRE) | Not available |
---
## Status pages
### Better Stack: included with incident management
[Better Stack Status Pages](https://betterstack.com/status-pages) is built into the platform and syncs automatically with incident management. Watch an overview:
Public and private pages, custom domains, subscriber notifications via email, SMS, Slack, and webhook, scheduled maintenance windows, and SAML SSO for private pages are all included.
### Airbrake: not available
Airbrake does not offer status pages. If you need to communicate incidents to users or customers, you integrate a separate tool (Statuspage.io, Instatus, or similar). This is consistent with Airbrake's scope as an error tracker, but it adds another vendor to the stack for teams that need external communication alongside error monitoring.
| Status pages | Better Stack | Airbrake |
|--------------|--------------|---------|
| **Included** | Yes | No |
| **Incident sync** | Automatic | N/A |
| **Subscriber notifications** | Email, SMS, Slack, webhook | N/A |
| **Custom branding** | Yes | N/A |
| **Pricing** | Included with platform | N/A (external tool required) |
---
## AI and MCP
### Better Stack: AI SRE and MCP server
**AI SRE** activates during incidents, analyzing your service map, querying logs, reviewing recent deployments, and generating root cause hypotheses without manual prompting. At 3am, this means starting from a hypothesis rather than a blank interface.
The **[Better Stack MCP server](https://betterstack.com/docs/getting-started/integrations/mcp/)** connects Claude, Cursor, and any MCP-compatible client directly to your observability data. Your AI assistant can query logs, check on-call schedules, acknowledge incidents, and build dashboard queries through natural language rather than context-copying.
Configuration is a single JSON block:
```json
{
"mcpServers": {
"betterstack": {
"type": "http",
"url": "https://mcp.betterstack.com"
}
}
}
```
The MCP server is generally available to all Better Stack customers, not gated behind a preview or allowlist.
### Airbrake: no AI investigation or MCP
Airbrake does not currently offer an AI investigation feature, an MCP server, or AI coding integrations. Error context must be copied manually into an AI assistant for analysis. For teams that have integrated Claude Code or Cursor into their debugging workflow, this is a meaningful gap, since Better Stack's pre-made prompts can pull error context directly rather than requiring copy-paste.
| AI / MCP | Better Stack | Airbrake |
|----------|--------------|---------|
| **AI SRE (autonomous investigation)** | Yes | No |
| **MCP server** | Yes (GA) | No |
| **AI coding integration** | Claude Code + Cursor (pre-made prompts) | Manual (no integration) |
| **Natural language queries** | Via MCP | Not available |
---
## Integration and deployment
### Better Stack
Integrations: 100+ covering all major stacks: MCP, OpenTelemetry, Vector, Prometheus, Kubernetes, Docker, PostgreSQL, MySQL, Redis, MongoDB, Nginx, and more. Here is how OpenTelemetry integrates with Better Stack:
Vector for log processing pipelines:
**For migrating from Airbrake:** Better Stack accepts Sentry SDK payloads, and Airbrake notifiers use a compatible exception format. Pointing your existing instrumentation at Better Stack's ingest endpoint typically requires a configuration change, not a code rewrite.
### Airbrake
Airbrake supports over 50 languages, frameworks, and libraries. Notifiers install in minutes, are agentless and serverless, and have near-zero impact on application performance.
Integrations include GitHub, Trello, Slack, JIRA, Pivotal Tracker, GitHub Enterprise, GitLab, GitLab CE/EE, Bitbucket, and custom webhooks. Popular companies using Airbrake include Netflix, Ring, Adobe, and Soundcloud.
Airbrake's breadth of language support is one of its strongest selling points. If your stack includes an unusual language or framework, Airbrake likely has a community-supported notifier or an API-based path for sending exceptions. Better Stack's Sentry SDK compatibility covers most major languages through existing Sentry notifiers, but the directly-supported SDK list is narrower.
| Integration aspect | Better Stack | Airbrake |
|-------------------|--------------|---------|
| **Languages** | Via Sentry SDK (50+ languages) | 50+ native notifiers |
| **OpenTelemetry** | Native first-class | Not supported |
| **CI/CD integrations** | GitHub, GitLab, CircleCI, and more | GitHub, GitLab, Bitbucket, and more |
| **Chat integrations** | Slack, Teams | Slack, Teams, and more |
| **Issue trackers** | JIRA, Linear, GitHub Issues | JIRA, GitHub, Trello, Pivotal Tracker |
---
## Enterprise readiness
Both platforms clear the baseline enterprise requirements. The differences emerge at the edges of compliance and support structure.
Better Stack covers what most enterprise procurement checklists require: SOC 2 Type II, GDPR, SSO via Okta/Azure/Google, SCIM provisioning, RBAC, audit logs, and data residency options (EU and US regions, plus optional hosting in your own S3 bucket). Enterprise customers get a dedicated Slack channel for support and a named account manager.
Airbrake (now a LogicMonitor company) is SOC 2 Type II certified and GDPR compliant. SSO is available via GitHub, OneLogin, and Okta. Audit logs are included on the Pro tier. Airbrake does not publish HIPAA or FedRAMP compliance certifications.
| Enterprise feature | Better Stack | Airbrake |
|-------------------|--------------|---------|
| **SOC 2 Type II** | Yes | Yes |
| **GDPR** | Yes | Yes |
| **HIPAA** | No | No |
| **SSO (SAML/OIDC)** | Okta, Azure, Google | GitHub, OneLogin, Okta |
| **SCIM provisioning** | Yes | Not published |
| **RBAC** | Yes | Yes |
| **Audit logs** | Yes | Pro tier and above |
| **Data residency** | EU + US regions, optional S3 | Airbrake-hosted only |
| **Dedicated support channel** | Slack channel + named account manager | Enterprise support via LogicMonitor |
| **SLA** | Enterprise SLA available | Available |
| **Self-hosted data** | Optional (your S3 bucket) | Not available |
---
## User experience and interface
### Better Stack
One interface for all signal types. The same SQL or PromQL syntax works whether you are querying logs, traces, or metrics. When an alert fires, the investigation view shows the service map, relevant logs, metric anomalies, and trace examples together without requiring navigation across products.
Customizing the Live Tail view to match your workflow:
**Onboarding time:** Hours for basic setup, a day or two to explore the full feature surface.
### Airbrake

Airbrake's interface is clean and narrowly focused on error management. The dashboard shows grouped errors, deploy bars, hotspot files, and project-level health in a single view. There is no navigation across products because there is only one product.
Intelligent grouping and duplicate detection ensure users are not overwhelmed by trivial errors or notification floods. The aggregation views are well-organized, and the deploy-to-error timeline is easy to read.
The G2 rating of 4.4/5 is solid. Some G2 reviewers note that the alerting system is less flexible than expected and that the interface feels less intuitive than alternatives in its category. For teams coming from Sentry or Rollbar, the UI can feel a step behind on workflow automation features like auto-assignment rules and priority scoring.
**Onboarding time:** Under three minutes to first error report. The learning curve is minimal because the scope is narrow.
| UX aspect | Better Stack | Airbrake |
|-----------|--------------|---------|
| **Learning curve** | Moderate (broader feature surface) | Low (focused scope) |
| **Time to first error** | Minutes (SDK redirect) | Under 3 minutes |
| **Unified interface** | Yes (all telemetry together) | Yes (within error tracking scope) |
| **Query language** | SQL + PromQL | Error-specific filters |
| **G2 rating** | Not listed separately for error tracking | 4.4/5 |
---
## Final thoughts
If your team only needs **basic error tracking**, Airbrake is still a solid choice. It’s quick to install, easy to use, and does a good job grouping exceptions and tying them back to deployments. For smaller applications or teams that already have the rest of their monitoring stack figured out, Airbrake keeps things simple and predictable.
The challenge is that most modern teams eventually need more than just error reports. They also need **logs, metrics, tracing, uptime monitoring, and incident response**. In practice, that often means pairing Airbrake with several other tools and then trying to connect everything together during an outage or production issue.
Better Stack takes the opposite approach by combining **error tracking, log management, distributed tracing, infrastructure monitoring, incident management, and status pages into a single platform**. Instead of jumping between multiple dashboards during an incident, teams can investigate everything from one place using shared data and a unified interface.
The platform also leans heavily into modern workflows. Features like the **MCP server for AI assistants** and the **AI SRE for automated incident investigation** are designed for teams that want observability tools to do more than just surface alerts.
For teams that have outgrown standalone error tracking and now need **full-stack observability**, Better Stack is the stronger long-term choice. But if your needs are genuinely lightweight and you already have reliable tooling for logs, monitoring, and on-call workflows elsewhere, Airbrake still delivers good value for what it focuses on.
Ready to see how Better Stack handles error tracking alongside everything else? [Start your free trial](https://betterstack.com) and connect your first Sentry-compatible notifier in just a few minutes.